
Stations in sync
- steadramon
-
 Topic Author
- Offline
- Senior Member
-

Less
More
- Posts: 40
- Thank you received: 13
2 years 10 months ago - 2 years 10 months ago #6619
by steadramon
Stations in sync was created by steadramon
I have the fortune to have a number of different counters, with varying collection method, tubes and firmware...
I recently went on holiday for ~2 weeks (31st August - 15th September) - during this time I saw a remarkable sync-up of the counters in my house.
Whilst there are commonalities between some of these, the number of different combinations is what has me convinced that this phenomenon is real... for example GC10Next count collection via UART and Pulse counting on others. Old firmware I haven't touched in years and recent firmware I've written....ESP8266 and ESP32, counters from various places and controlled by different mechanisms.. so what is it?
I'm in a 5-10% Radon area, could it be because there were no doors or windows open during this time?
steadramon
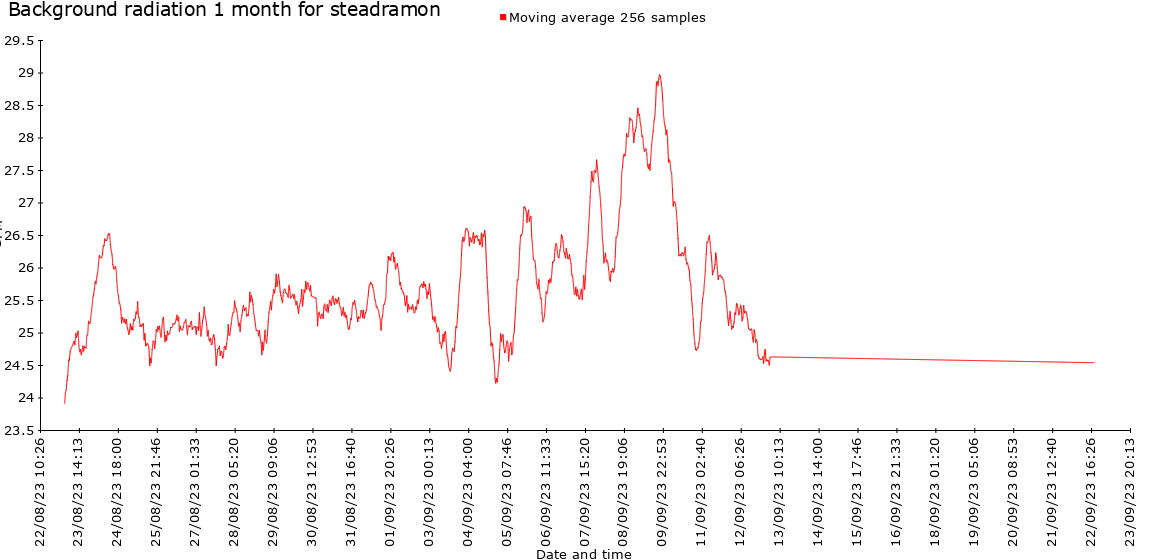
Pulse counter with SMB-20. ESP8266. Firmware from several years ago, bit flakey, submission by node-red
Note: only counter in a case. crashed ~13th September
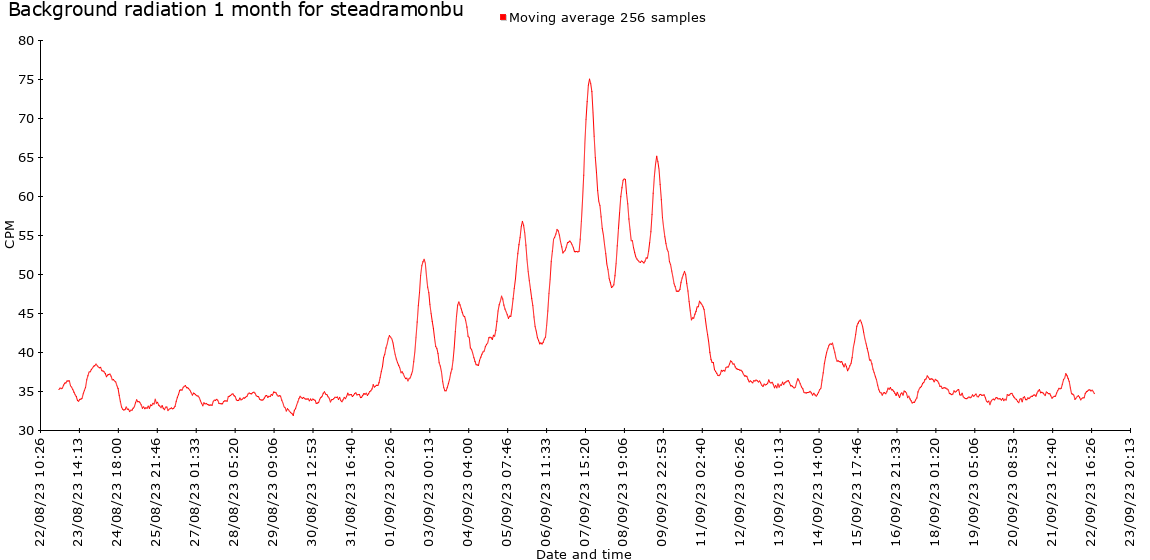
steadramonbu
Pulse counter ESP32 CAJOE unit with M4011 tube. A very basic firmware from about a year ago. Submitted by ESP
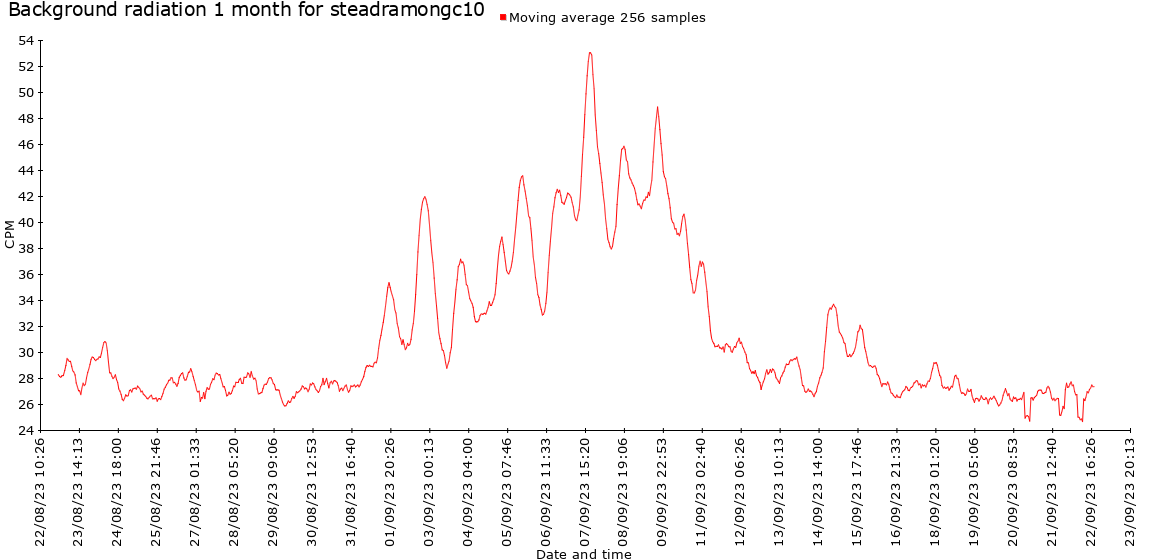
steadramongc10
ESP32 connected to GC10next, ESPGeiger, collecting data via serial UART value
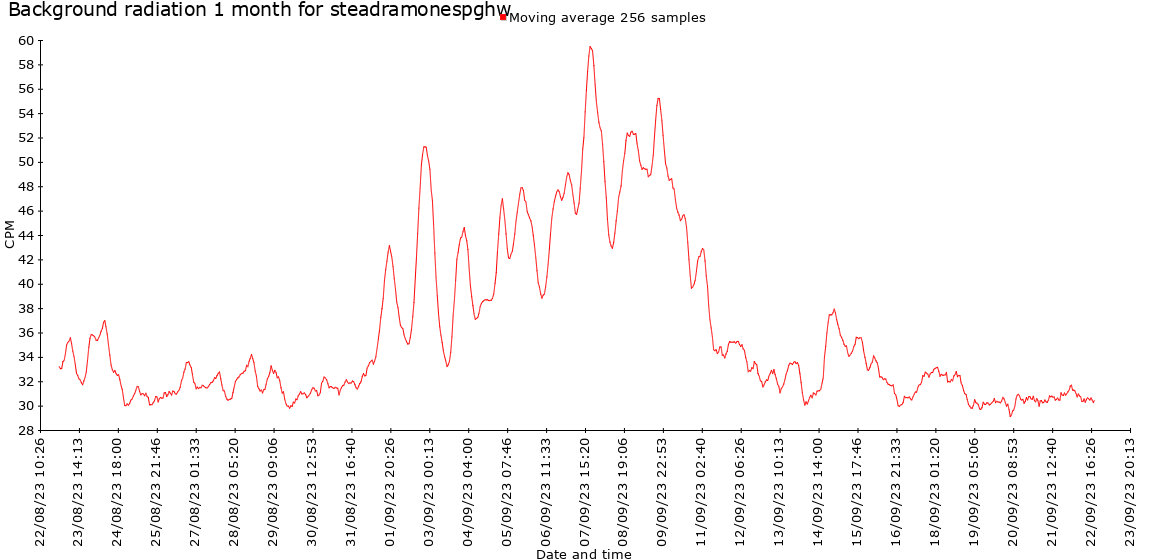
steadramonespghw
Hardware version 1 of ESPGeiger-HW with STS-5 tube (pulse counter, no voltage feedback) with ESPGeiger firmware
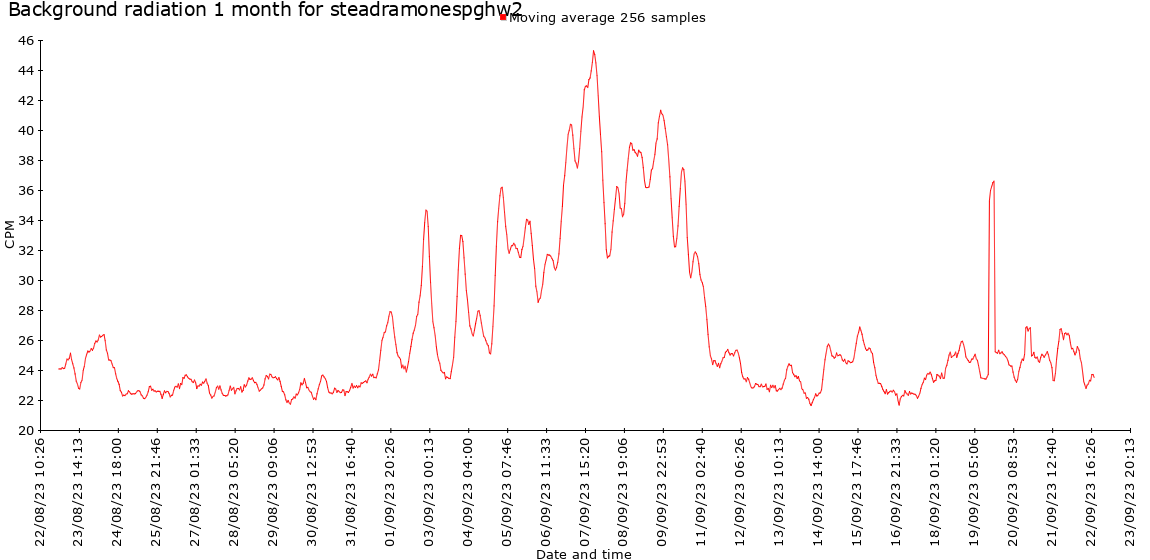
steadramonespghw2
Hardware version 2 of ESPGeiger-HW with J305 tube (pulse counter, voltage feedback) with ESPGeiger firmware
Note: the spike on the morning of 20th is me "playing" with some pendants
I recently went on holiday for ~2 weeks (31st August - 15th September) - during this time I saw a remarkable sync-up of the counters in my house.
Whilst there are commonalities between some of these, the number of different combinations is what has me convinced that this phenomenon is real... for example GC10Next count collection via UART and Pulse counting on others. Old firmware I haven't touched in years and recent firmware I've written....ESP8266 and ESP32, counters from various places and controlled by different mechanisms.. so what is it?
I'm in a 5-10% Radon area, could it be because there were no doors or windows open during this time?
steadramon
Pulse counter with SMB-20. ESP8266. Firmware from several years ago, bit flakey, submission by node-red
Note: only counter in a case. crashed ~13th September
steadramonbu
Pulse counter ESP32 CAJOE unit with M4011 tube. A very basic firmware from about a year ago. Submitted by ESP
steadramongc10
ESP32 connected to GC10next, ESPGeiger, collecting data via serial UART value
steadramonespghw
Hardware version 1 of ESPGeiger-HW with STS-5 tube (pulse counter, no voltage feedback) with ESPGeiger firmware
steadramonespghw2
Hardware version 2 of ESPGeiger-HW with J305 tube (pulse counter, voltage feedback) with ESPGeiger firmware
Note: the spike on the morning of 20th is me "playing" with some pendants
Attachments:
Last edit: 2 years 10 months ago by steadramon.
Please Log in or Create an account to join the conversation.
2 years 10 months ago - 2 years 10 months ago #6624
by Simomax
Replied by Simomax on topic Stations in sync
This really is quite fantastic! In all my time with radiation/counters etc. I have never ever seen such a show of synchronicity between counters ever! Well done! I think this is a first for radmon!
I have downloaded the CSV files for the your monthly graphs. I plan to throw them into excel soon and see what they look like overlaid each other. I have attached them here if anyone else wants to play about with the numbers. I had to zip them up as the forum editor won't allow .CSV. I'll see if I can change that at some point.
I have downloaded the CSV files for the your monthly graphs. I plan to throw them into excel soon and see what they look like overlaid each other. I have attached them here if anyone else wants to play about with the numbers. I had to zip them up as the forum editor won't allow .CSV. I'll see if I can change that at some point.
Attachments:
Last edit: 2 years 10 months ago by Simomax.
Please Log in or Create an account to join the conversation.
2 years 9 months ago - 2 years 9 months ago #6665
by Bert490
Replied by Bert490 on topic Stations in sync
I looked into this some years ago, after seeing similar results at Netc.com. I didn't see it often, but from the research articles I read, this is how it can be explained: Radon is more or less constantly produced by local Uranium decay underground, and the gas percolates through ground layers depending on porosity, which depends in part on water content. Another variable is air pressure which changes with temperature, and wind. Daily increases in CPM sometimes occur, which could be caused by warm surface air drawing cooler, more dense ground gases upward (more so if the ground is dry), and when the sun rises on quiet mornings, resultant breezes waft pools of heavier Radon-laden air to the sensor location. The ground water effect on Radon seepage can also explain seasonal variations shown on some multi-year charts.
--Bert
--Bert
Last edit: 2 years 9 months ago by Bert490.
The following user(s) said Thank You: steadramon
Please Log in or Create an account to join the conversation.
Moderators: Gamma-Man
Time to create page: 0.158 seconds