×
RadLog
Problem with RadLog graph
8 years 8 months ago #3045
by stdorn01
Replied by stdorn01 on topic Problem with RadLog graph
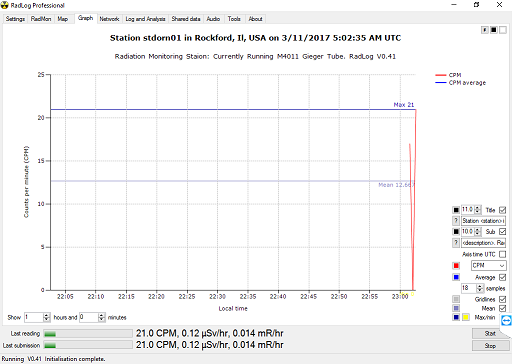
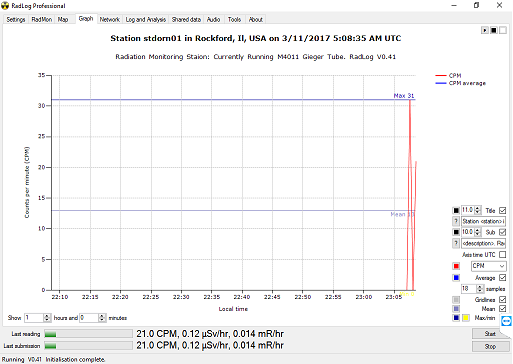
I have the same issue. I re-checked axis time UTC and it now graphs correctly. (I was only showing 2-3 datapoints on graph.)
Please Log in or Create an account to join the conversation.
8 years 8 months ago - 8 years 8 months ago #3046
by stdorn01
Replied by stdorn01 on topic Problem with RadLog graph
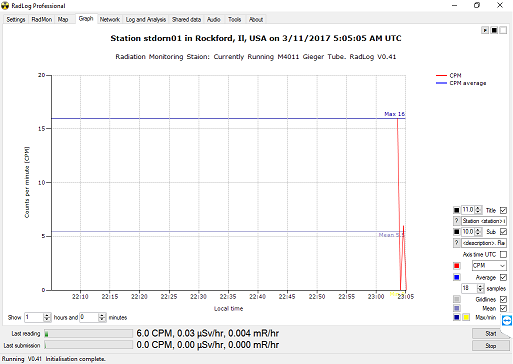
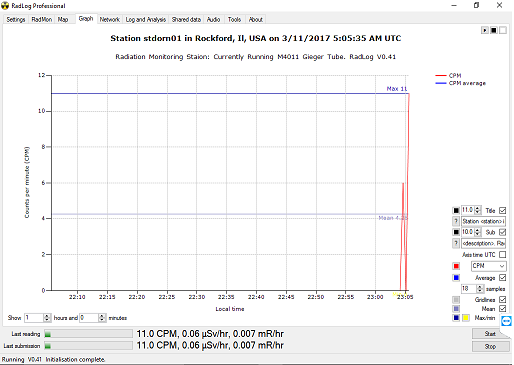
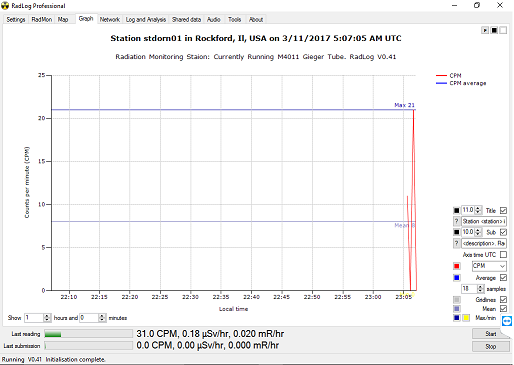
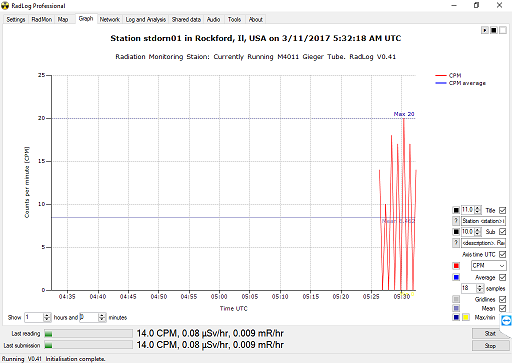
I have attached screenshots @ 1,3,4,5, and 6 minute increments to show an example. all I did to cause this was uncheck the UTC box. The last post show 6 minutes with the UTC checked. I can check and uncheck the box while radlog is running with no issue but if left unchecked the graph messes up after closing and restarting radlog. If UTC is rechecked and rad log is restarted the graph works again. Hope fully this info will help with debugging.
Last edit: 8 years 8 months ago by stdorn01.
Please Log in or Create an account to join the conversation.
8 years 8 months ago #3047
by stdorn01
Replied by stdorn01 on topic Problem with RadLog graph
I have attached screenshots @ 1,3,4,5, and 6 minute increments to show an example. all I did to cause this was uncheck the UTC box. The last post show 6 minutes with the UTC checked. I can check and uncheck the box while radlog is running with no issue but if left unchecked the graph messes up after closing and restarting radlog. If UTC is rechecked and rad log is restarted the graph works again. Hope fully this info will help with debugging.
Please Log in or Create an account to join the conversation.
8 years 8 months ago #3048
by Simomax
Replied by Simomax on topic Problem with RadLog graph
This looks like the same issue as this: http://radmon.org/index.php/kunena/howtos-and-faqs/563-request-for-assistance-cpm-bounces-from-actual-to-0
Could it be that you have more than one instance of Radlog running?
Could it be that you have more than one instance of Radlog running?
The following user(s) said Thank You: stdorn01
Please Log in or Create an account to join the conversation.
8 years 8 months ago #3050
by stdorn01
Replied by stdorn01 on topic Problem with RadLog graph
No if I do that one instance will say can't connect to com port and it will not show any data at all.
Please Log in or Create an account to join the conversation.
8 years 8 months ago #3051
by stdorn01
Replied by stdorn01 on topic Problem with RadLog graph
thank you for pointing out the zero count thing I had noticed it looked weird and my average was lower than it should be I had my geiger counter set to Output to serial Port every minute and the software was taking a sample every 30 seconds so every other reading was 0 because the serial Port wasn't putting any data out a got that fixed but the graphing two or three data points thing was a separate problem.
Thanks again,
Steve
Thanks again,
Steve
The following user(s) said Thank You: Simomax
Please Log in or Create an account to join the conversation.
Moderators: Gamma-Man
Time to create page: 0.195 seconds

