
- Forum
- Alerts, Detections and Station Updates
- Station detections
- Increased CPM with rain and humidity.
Increased CPM with rain and humidity.
2 years 8 months ago - 2 years 8 months ago #6770
by Juzzie
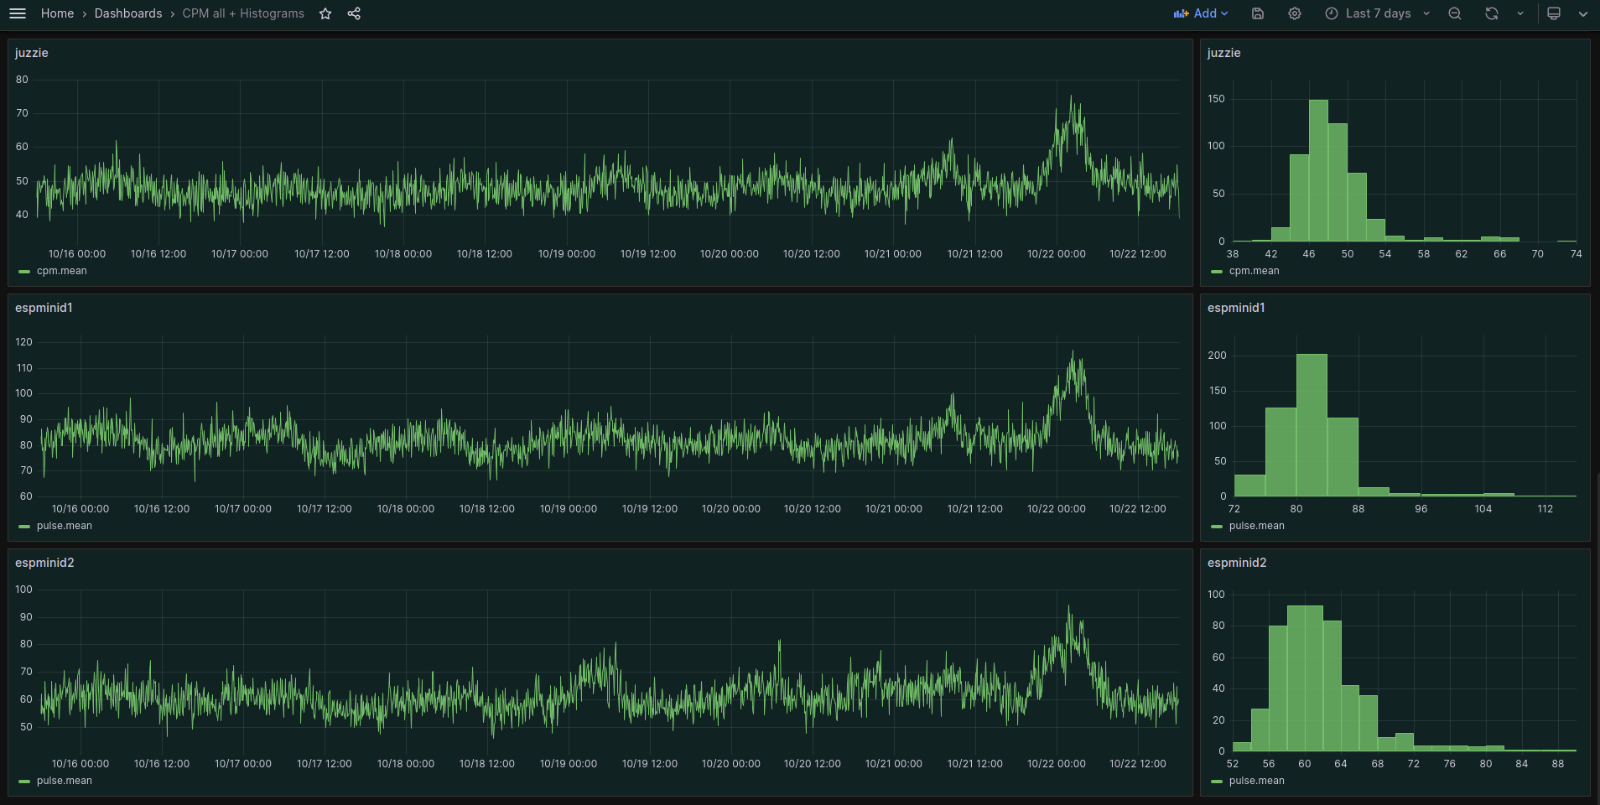
Three charts with data for the last 7 Days, Two different locations. 'juzzie' - SBM-19, 'espminid2' - 2x SI-180g, both outdoors, And 'espminid1' - SBT-10a, inside my tool trailer 30m away.
See the spike that was produced during last night's heavy rain.
Owner and operator of "southofhobart" monitoring stations.
Increased CPM with rain and humidity. was created by Juzzie
Three charts with data for the last 7 Days, Two different locations. 'juzzie' - SBM-19, 'espminid2' - 2x SI-180g, both outdoors, And 'espminid1' - SBT-10a, inside my tool trailer 30m away.
See the spike that was produced during last night's heavy rain.
Owner and operator of "southofhobart" monitoring stations.
Attachments:
Last edit: 2 years 8 months ago by Juzzie.
Please Log in or Create an account to join the conversation.
2 years 8 months ago #6778
by Bert490
Replied by Bert490 on topic Increased CPM with rain and humidity.
I recall discussions on this phenomenon some years ago on Netc.com. Rain washout of Radon and progeny from the sky is often seen on some outdoor detectors. It would depend on local soil properties and perhaps a low pressure weather cell drawing more air up before the rain. Here are 2 articles describing it in more detail:
Weblog article
,
Research Journal article
.
Please Log in or Create an account to join the conversation.
2 years 8 months ago - 2 years 8 months ago #6781
by Juzzie
Owner and operator of "southofhobart" monitoring stations.
Replied by Juzzie on topic Increased CPM with rain and humidity.
Yes Bert490, Radon daughters are most probably is the culprit. Also associated with the washout is 7Be, which is a key reason why a swab sample from a collection surface (say, the roof of a shed) giving off persistently high counts weeks after collection.
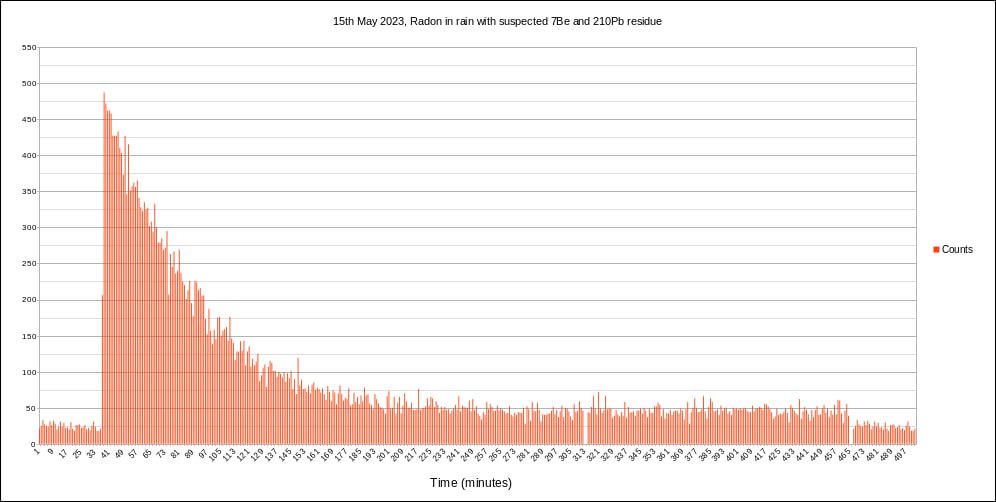
Data points 313-465 recorded 2 weeks after this swab was collected, and 465 onwards is the swab before collection (placed there in the chart for comparison).
I actually sent a swab like this one to a friend with a gamma scintillator some time ago for testing and the results confirmed the theory
Data points 313-465 recorded 2 weeks after this swab was collected, and 465 onwards is the swab before collection (placed there in the chart for comparison).
I actually sent a swab like this one to a friend with a gamma scintillator some time ago for testing and the results confirmed the theory
Owner and operator of "southofhobart" monitoring stations.
Attachments:
Last edit: 2 years 8 months ago by Juzzie.
Please Log in or Create an account to join the conversation.
2 years 8 months ago #6782
by Juzzie
Owner and operator of "southofhobart" monitoring stations.
Replied by Juzzie on topic Increased CPM with rain and humidity.
There is a case study is on the subject here - https://pubmed.ncbi.nlm.nih.gov/15511568/
And an explanation below
And an explanation below
Owner and operator of "southofhobart" monitoring stations.
Attachments:
Please Log in or Create an account to join the conversation.
2 years 8 months ago #6789
by Simomax
Replied by Simomax on topic Increased CPM with rain and humidity.
I like your graphs Juzzie. Especially in your first post. They look good. What do you use to generate them?
Going back to the topic; I have had three, maybe four events like that in the past, since 2016. I even wiped a load of dirt from the car after one once. Didn't detect much though. Maybe a few CPM increase, but hard to tell as the counters are very much up and down anyway. I'll have a read of the PDF soon. Looks interesting.
Going back to the topic; I have had three, maybe four events like that in the past, since 2016. I even wiped a load of dirt from the car after one once. Didn't detect much though. Maybe a few CPM increase, but hard to tell as the counters are very much up and down anyway. I'll have a read of the PDF soon. Looks interesting.
Please Log in or Create an account to join the conversation.
2 years 8 months ago - 2 years 8 months ago #6794
by Juzzie
The data for the decay chart was created using an LND-7317 with GK-B5 counter and visualization created with LibreCalc.
Owner and operator of "southofhobart" monitoring stations.
Replied by Juzzie on topic Increased CPM with rain and humidity.
I have all my data going into an influxdb database on a Raspberry Pi 4B, and use Grafana for my visualizations. It is very easy to set up using DietPi OS, and super easy to use.I like your graphs Juzzie. Especially in your first post. They look good. What do you use to generate them?
The data for the decay chart was created using an LND-7317 with GK-B5 counter and visualization created with LibreCalc.
Owner and operator of "southofhobart" monitoring stations.
Last edit: 2 years 8 months ago by Juzzie.
Please Log in or Create an account to join the conversation.
Moderators: Gamma-Man
- Forum
- Alerts, Detections and Station Updates
- Station detections
- Increased CPM with rain and humidity.
Time to create page: 0.184 seconds