
- Forum
- Software discussions
- radmon.org
- Delay in data availability from real-time to historical download
Delay in data availability from real-time to historical download

just a quick question, what is the time delay from the data coming in in real-time for it to be available via the historical download button on the station page?
Many thanks,
Matthias
Please Log in or Create an account to join the conversation.
Good question, well presented, deserves an answer!

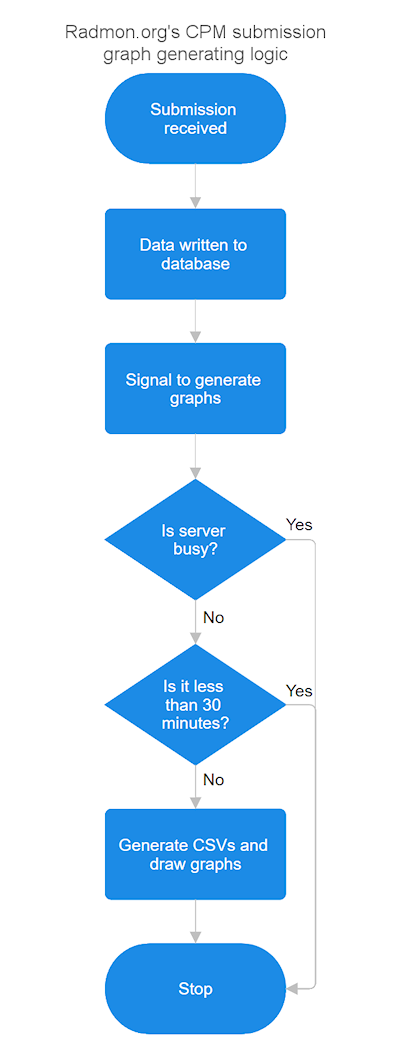
The downloadable CSVs are generated when the graphs are drawn, and the graphs are drawn when the server feels like it, after 30 minutes. Really, it is like that. Dan wrote some clever code to see how busy the server is at any given time. If the server is too busy it won't attempt to generate the graphs, and when it attempts graph generation it checks if the last time was 30 minutes or less. If less it skips it, if not it will generate the CSVs then build the graphs from the CSVs. Such as: submission comes in --> data stored --> is server busy? yes = stop / no --> is it less than 30 mins since last generation? yes = stop / no --> generate CSVs and graphs. I'll add a flow chart to the bottom of this post, that should make it easier to understand.
You can force just one graph, or all of them. However the server busy logic still exists. So even with a force refresh, if the server is too busy it will gracefully stop.
This is the function to redraw all:
Forcing a refresh ignores the 30 minute delay between generations, and it is not recommended to use in an automated way. The function is more for diagnostics than actual use. When graphs are generated it really impacts server performance. It has to pull a load of data from the database, average, compress and smush it into several CSVs, then draw several PNGs, one from each CSV. This really uses some CPU and IO so isn't recommended to spam the command or automate it. I just timed a full refresh and it took 1 minute 27 seconds.Function: forcegraphrefresh
Parameters: user
Description: Forces a refresh of the station's graphs.
Example: https://radmon.org/radmon.php?function=forcegraphrefresh&user=Simomax
Returns: 'Graphs successfully generated.' if successful, or 'Server is too busy. Try again another time.' if server load is high.

Attachments:
Please Log in or Create an account to join the conversation.
Please Log in or Create an account to join the conversation.
If the server regenerates this automatically, would there be any reason why the csv download at https://radmon.org/UserGraphs/mmbytes/datayear.csv would be stuck at "2026-05-18 00:57:12".?
Whenever I click on the link I get a file with this header:
"1 year radiation data generated on 2026-05-18 00:57:12"
Many thanks, Matthias
Please Log in or Create an account to join the conversation.
Is there a bug in the limiter?
When I use
I get the replyhttps://radmon.org/radmon.php?function=lastreadingusv&user=mmbytes&password=xxxxxxx
When I use0.120 uSv/hr on 2026-05-28 02:03:35UTC at Oatlands, NSW, Australia
(Same password obviously) I get the following responsehttps://radmon.org/radmon.php?function=forcegraphrefresh&user=mmbytes&password=xxxxxxx
Fatal error in RadMon : Wrong password specified - function limited - see radmon.org forums
Also, when I use the wrong password for
I get the responsehttps://radmon.org/radmon.php?function=lastreadingusv&user=mmbytes&password=yyyyyyyy
Incorrect.
Can you please check?
Many thanks,
Matthias
Please Log in or Create an account to join the conversation.
I haven't ever looked at the averaging code, but this looks normal looking at the other CSVs. I suspect there isn't enough samples to work out the averaging right up to date. It looks like you are submitting every 2 minutes or so. Maybe increase that to every minute and it should give some extra samples but you won't get right up to date, you may still end up 4 or so days missing form the end. It's also important to bear in mind that the CSV's, IFAIK, are processed data, not the raw data stored in the database.If the server regenerates this automatically, would there be any reason why the csv download at https://radmon.org/UserGraphs/mmbytes/datayear.csv would be stuck at "2026-05-18 00:57:12".?
Whenever I click on the link I get a file with this header:
"1 year radiation data generated on 2026-05-18 00:57:12"
No, it's working as designed.Is there a bug in the limiter?
That's correct. I implemented the data sending password for lastreadingusv and lastreadingWhen I use
I get the replyhttps://radmon.org/radmon.php?function=lastreadingusv&user=mmbytes&password=xxxxxxx
0.120 uSv/hr on 2026-05-28 02:03:35UTC at Oatlands, NSW, Australia
Again, this is normal. The password I implemented for the graph generation is not your data sending password. It's a different password. This was to disable the use of this for now, for everyone. The same was implemented for forcegraphrefresh, drawall, graphtoday, graphweek, graphmonth, graphquarter, drawgraph24hr and drawsmallgraphWhen I use
(Same password obviously) I get the following responsehttps://radmon.org/radmon.php?function=forcegraphrefresh&user=mmbytes&password=xxxxxxx
Fatal error in RadMon : Wrong password specified - function limited - see radmon.org forums
This is also correct. You need to use your data sending password for this API function. If you use a wrong password, you get 'incorrect'.Also, when I use the wrong password for
I get the responsehttps://radmon.org/radmon.php?function=lastreadingusv&user=mmbytes&password=yyyyyyyy
Incorrect.
The current API functions that have been restricted/limited have been done so as the server was getting hammered with API lookups by external systems. After going through everything with a fine tooth comb it turned out to be 95% of the API lookups were being performed by automated processes out there, simply sucking up data. Anything from a handful of stations to the entire station list, along with CPM and locations, and this was happening every few minutes and combined, every few seconds. This shouldn't be a permanent thing, and neither Dan nor I want to restrict things, but at the same time can't have external systems consuming more resources than the radmon users themselves.
We are looking into a solution that suits everyone and also to do a one-time permanent fix. We don't want to make some changes only to break everyone's data collection and then change and break some more later. There will be changes, so it will break some people's data collection, as adding in the password has already. There are around 10 users that are using the API for their own legitimate purposes and that is all out of 340 stations right now. Two of the users are using the API call to feed data into Home Assistant, the other 8 or so look to be for either ESP/Arduino type devices or web servers. Again the API usage from the radmon users has been fair legitimate use. All of the other 95% was all from IP addresses that have no relation (that I can see) to radmon itself. I cross referenced the IP addresses with the IPs from the data submission and none matched, so I am assuming they aren't even members of radmon.org, or at least don't submit to radmon. Since restricting the functions the server has been responding much better and I'm seeing less timeouts than prior.
I have thought about this and I think a good solution would be to implement a username/password for all API functions. Every radmon user that submits data to radmon.org automatically gets fully unfettered access to all API commands. Other users can use the API but they must be a registered user of radmon (they don't need a station, but do need a login) and need to apply for API use. (Currently anyone whether registered or not has access to the API - It's wide open). Access will generally be granted, probably automatically but this leaves the keys with Dan and I and we can monitor and switch off any user's individual API access. By doing it like this even if one user starts hammering the API, we can just switch a flag and then the abuser's access to the API is revoked and this doesn't affect any other users. I'll also be implementing a separate logging system for the API functions. Maybe a counter too, so users have X API lookups per day or something, after that they need to wait until the next day for the count to reset and gain access again. All of these things are quite similar to what other online API services do these days. We're just a bit behind with this kind of thing. But then, radmon has never been hammered so much until recently, so there has been no need to look at it.
I hope this explains everything. If not let me know.
Cheers
Please Log in or Create an account to join the conversation.
- Forum
- Software discussions
- radmon.org
- Delay in data availability from real-time to historical download