
×
RadLog
Spikes on CPM graph
10 years 3 months ago #2030
by Simomax
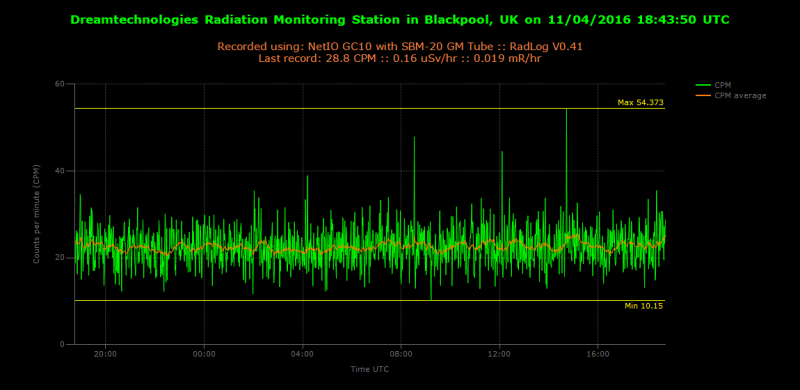
Spikes on CPM graph was created by Simomax
Since I have had my GC10 hooked up to Radlog I have noticed spikes anywhere betweeen 40 and 60 CPM. They seem to happen at random times or may not spike for 24 hours or so. I have two GC10's one with a proper SBM-20 and the other with a SBM-20u. I have swapped them around and still get the same. It also didn't change when I moved my monitoring counter outside and I still get strange spikes
Does anyone else get spikes like this? I'd like to hear of other GC10 users to see if this is a GC10 thing, or maybe it happens to everyone?
Cheers
Does anyone else get spikes like this? I'd like to hear of other GC10 users to see if this is a GC10 thing, or maybe it happens to everyone?
Cheers
Please Log in or Create an account to join the conversation.
10 years 3 months ago - 10 years 3 months ago #2032
by DExUS
Replied by DExUS on topic Spikes on CPM graph
I also had those, however stations close to me had them also at the same time, so I guess something went supernova or something and part of it hit the earth.
Happens all the time.
Happens all the time.
Last edit: 10 years 3 months ago by DExUS.
Please Log in or Create an account to join the conversation.
10 years 3 months ago #2033
by Simomax
Replied by Simomax on topic Spikes on CPM graph
Thanks for your reply DExUS.
At first I thought it was some kind of interference from some electronic something-or-other but after moving my counter outside and the same happening I got puzzled. I have another GC10 that I use as a mobile gps logging counter that I might put right along side of my outdoor counter. This logs the CPM every second to an SD card so I will be able to drill down and check the counts my mobile counter detected and compare against spikes in the graph.
It is not something I am worried about in the slightest, just very curious so I would like to get to the bottom of it. I had started to suspect they were erronious readings from the GC10 itself, but maybe not if others' experience the same. I also do have to bear in mind that my GC10 is a toy compared to proper monitoring stations and from what I ahve read the proper monitoring stations take an average reading over a period of time, such as an hour.
**Admin, I wrongly posted this in the news forum, I was supposed to post in the radlog forum. Can you please move this topic to the radlog forum, unless it is ok here?")
At first I thought it was some kind of interference from some electronic something-or-other but after moving my counter outside and the same happening I got puzzled. I have another GC10 that I use as a mobile gps logging counter that I might put right along side of my outdoor counter. This logs the CPM every second to an SD card so I will be able to drill down and check the counts my mobile counter detected and compare against spikes in the graph.
It is not something I am worried about in the slightest, just very curious so I would like to get to the bottom of it. I had started to suspect they were erronious readings from the GC10 itself, but maybe not if others' experience the same. I also do have to bear in mind that my GC10 is a toy compared to proper monitoring stations and from what I ahve read the proper monitoring stations take an average reading over a period of time, such as an hour.
**Admin, I wrongly posted this in the news forum, I was supposed to post in the radlog forum. Can you please move this topic to the radlog forum, unless it is ok here?
Please Log in or Create an account to join the conversation.
10 years 3 months ago - 10 years 3 months ago #2037
by DExUS
Replied by DExUS on topic Spikes on CPM graph
GC10 in it's core is very cleverly coded and it can be compared with any expensive GC, however the calibration and CPM-uSv conversion is the tricky part since every tube is a bit different.
Due to that it might not be super accurate however it is sensitive and well built.
modern GC's are very simple devices, because it's just a generator of HV (300-800V) , and a detector of pulses. Those pulses are then translated to counts per minute (or second) and converted via simple formula uSv = CPM * X , the variable X depends on the tube sensitivity on the type of radiation.
Last edit: 10 years 3 months ago by DExUS.
Please Log in or Create an account to join the conversation.
10 years 2 months ago #2060
by Simomax
Replied by Simomax on topic Spikes on CPM graph
I'm currently building my own geiger counter from scratch to try and get a better understanding of how they work. I take back what I said about the GC10 being a toy after scratching my head for a week trying to work out a decent algorithm to calculate the CPM. It would be nice to see under the hood of the GC10 but I think it is a closed source. I had a look at the GK-B5 source but I didn't like the way the CPM was calculated. That may be my fault though as I just loaded the code onto an arduino, and attached it to a signal generator without going through the menus of the GK-B5 software, so the results I got may be configurable. I should maybe get a GK-B5 to have a play about with.
I have come across a few hurdles with programming the arduino. The two main hurdles have been the speed of counting the counts and the algorithm for calculating the CPM, both of which I have worked out nice solutions for now. I have this built on a breadboard at the moment so just testing/developing, but I manage to get 136,000+ CPM with a LND712 tube and Americium-241 which is about the highest CPM source I have. The algorithm is relatively simple but took a little to work out. So far so good.
I have the PSU pretty much worked out now and have tried with a couple of designs. The display and calculations are pretty much worked out but need to make some kind of user interface. I'm struggling a little with the detector side of things though, the electronic theory of it.
Please Log in or Create an account to join the conversation.
10 years 2 months ago - 10 years 2 months ago #2061
by DExUS
Replied by DExUS on topic Spikes on CPM graph
Well, I have the source code for GC10 , but I am not sure if I can share it ...
I had built a GC with arduino and beleave me there is no problem with speed. Tested with apx 516000CPM theoretical maximum will be probably around 1800000 CPM.
There was even room some advanced features and with sound !
here you can find the HV / detection side of GC10 and some samples that I had used: http://www.dexus5.com/system3/nokia-geiger-counter/
works like a charm.
However that is not the best GC I had created, it's just a toy due to the small tube and lack of features.
Last edit: 10 years 2 months ago by DExUS.
Please Log in or Create an account to join the conversation.
Moderators: Gamma-Man
Time to create page: 0.872 seconds