
×
RadLog
When are the charts uploaded?
3 years 7 months ago - 3 years 7 months ago #6283
by Simomax
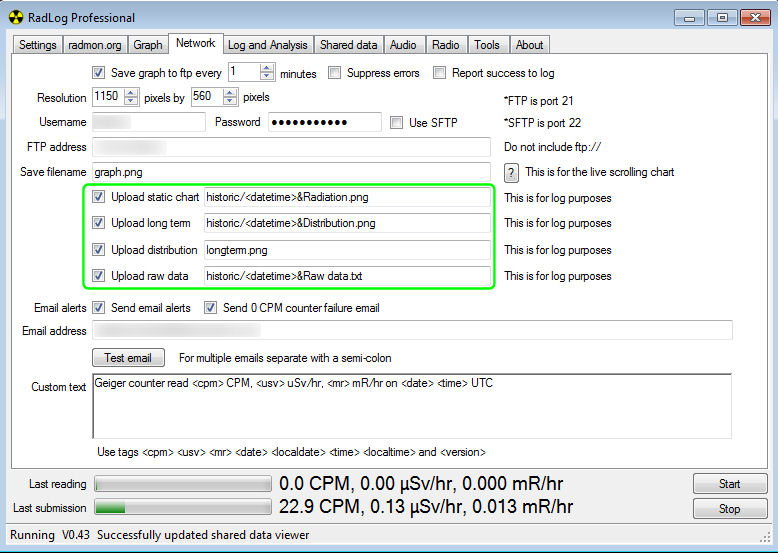
When are the charts uploaded?The others as highlighted on the image above, not the 'live' graph. I know they are ftp'd every day at some point, but when? What alerted me to this is yesterday's graphs haven't uploaded. I did stop and start radmon using the start and stop buttons, but I didn't close the application. It has been running for a while now, I simply stopped and started it.
Is the upload time taken 24 hours from when Radlog 'started'? Or is it some other time?
Ha! Ignore all that. It is 24 hours after the start button has been pressed, or the application loads up and starts automatically. Whilst I was writing this post today's charts dropped into their folder. So I have lost yesterday's due to stopping and restarting which is a bit of a shame. I suspect there are other days missing too from the past due to stopping and starting logging.
This is an extract from my log showing it is 24 hours after starting logging:
20/11/2022 18:25:08 : Logging with COM port started.
........
21/11/2022 18:25:10 : Saved graph data.
21/11/2022 18:25:10 : Saved chart image.
21/11/2022 18:25:10 : Exported interval log.
21/11/2022 18:25:10 : Saved distribution plot data.
When are the charts uploaded? was created by Simomax
When are the charts uploaded?
Is the upload time taken 24 hours from when Radlog 'started'? Or is it some other time?
Ha! Ignore all that. It is 24 hours after the start button has been pressed, or the application loads up and starts automatically. Whilst I was writing this post today's charts dropped into their folder. So I have lost yesterday's due to stopping and restarting which is a bit of a shame. I suspect there are other days missing too from the past due to stopping and starting logging.
This is an extract from my log showing it is 24 hours after starting logging:
20/11/2022 18:25:08 : Logging with COM port started.
........
21/11/2022 18:25:10 : Saved graph data.
21/11/2022 18:25:10 : Saved chart image.
21/11/2022 18:25:10 : Exported interval log.
21/11/2022 18:25:10 : Saved distribution plot data.
Attachments:
Last edit: 3 years 7 months ago by Simomax.
Please Log in or Create an account to join the conversation.
Moderators: Gamma-Man
Time to create page: 0.121 seconds