
- Forum
- Experiments and Projects
- Experiments
- Fun with the sun - The Solar Monitor 5 Million! (Experiment)
Fun with the sun - The Solar Monitor 5 Million! (Experiment)
2 weeks 5 days ago - 2 weeks 5 days ago #6932
by Simomax
I have been meaning to write this up for a couple of weeks now, and I finally do it. This is an experiment I am conducting (very loosely at present) that came about from leaving my CAJOE RadiationD-v1.1 with J305by on my window sill for a week and noticed a strange pattern with the 'excess' counts. They were stronger in the morning than in the afternoon, even to the point they were stronger than in direct sunlight. I mentioned this to a couple of members here and we all agree that it is strange, and that we all expected there to be more counts in direct sunlight than in the morning with indirect sunlight. I find this confusing and there has to be a reason, so this experiment is aimed at trying to figure out why. I don't know if it will work or not but I do now have enough data to show that direct sunlight doesn't seem to affect the tube more than indirect, morning sun.
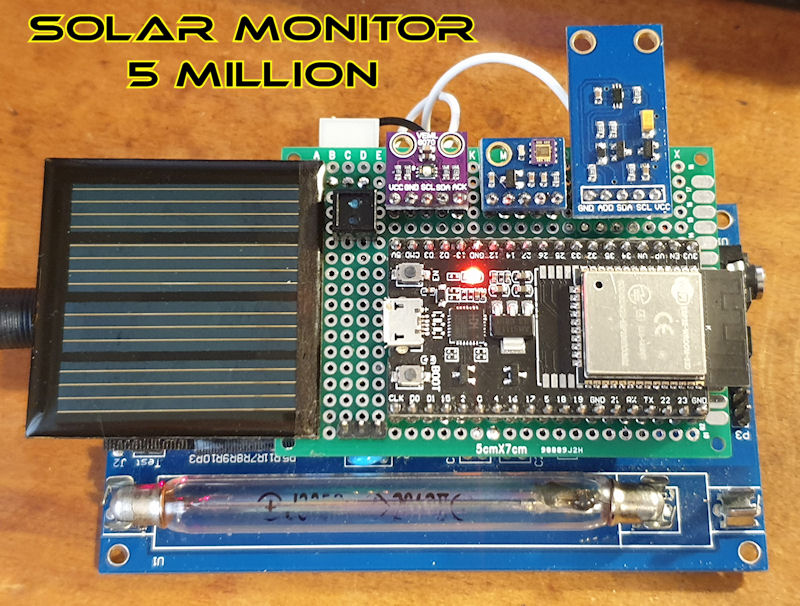
I had some light sensors and bits and bobs, so cobbled them together, hooked up to an ESP32 and started logging the data. And they grew into the 'Solar Monitor 5 Million!'
 (as pictured above.)
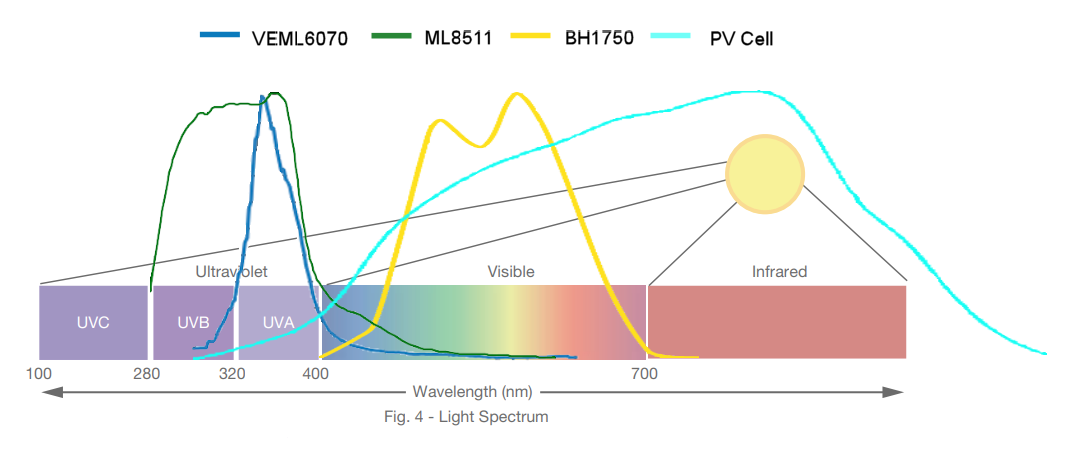
So, what does it do? It logs CPM from the RadiationD-v1.1 to here (station SimoTester3 ) and then there are 5 other sensors that log to my web server and Blynk. Blynk is so I can view on my phone. The array consists of the following sensors:
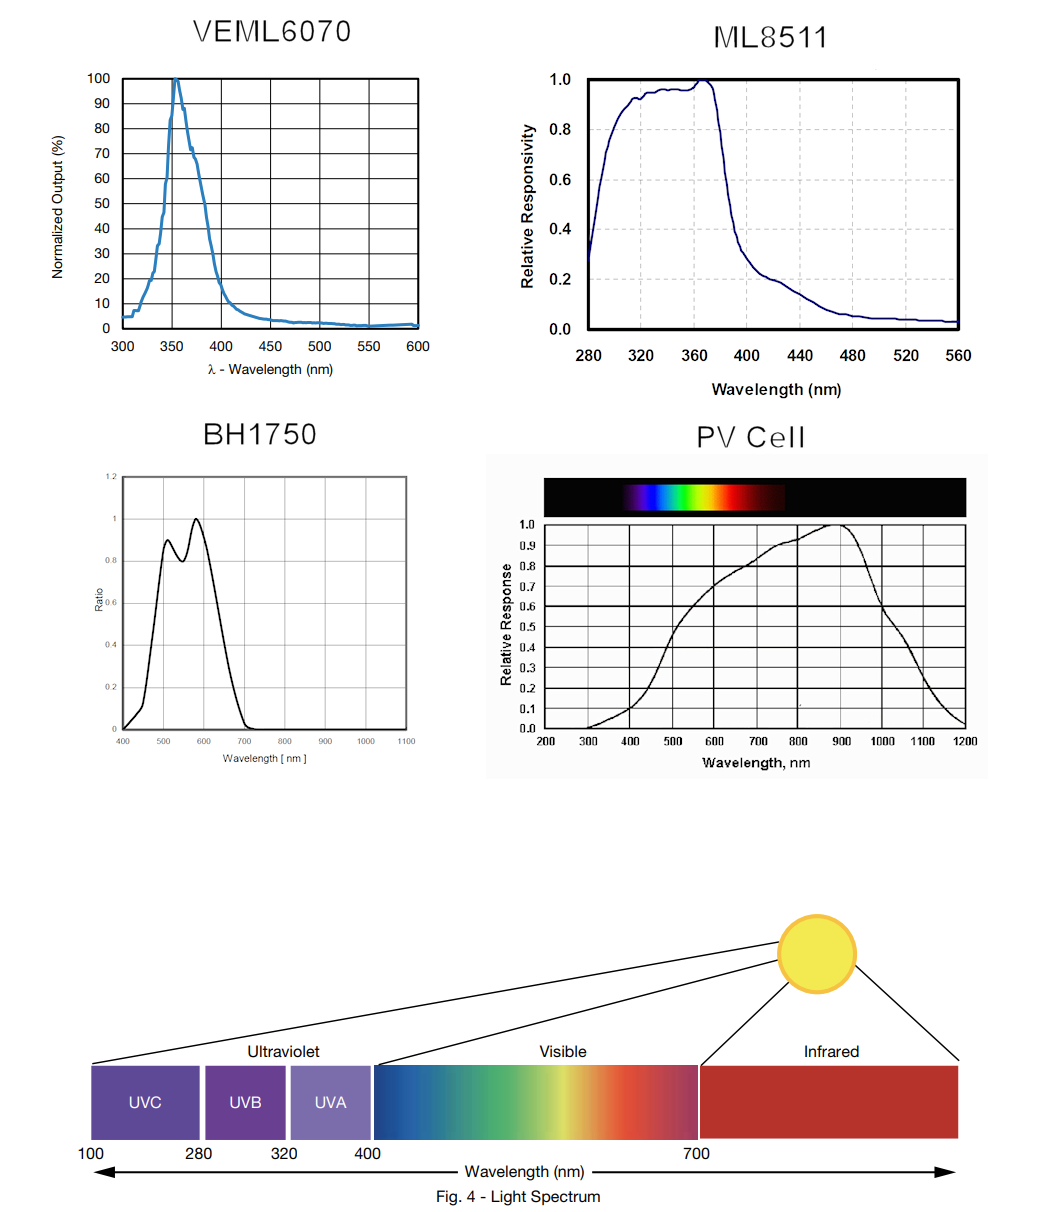
This image shows each sensor's spectrum over the visible light spectrum.
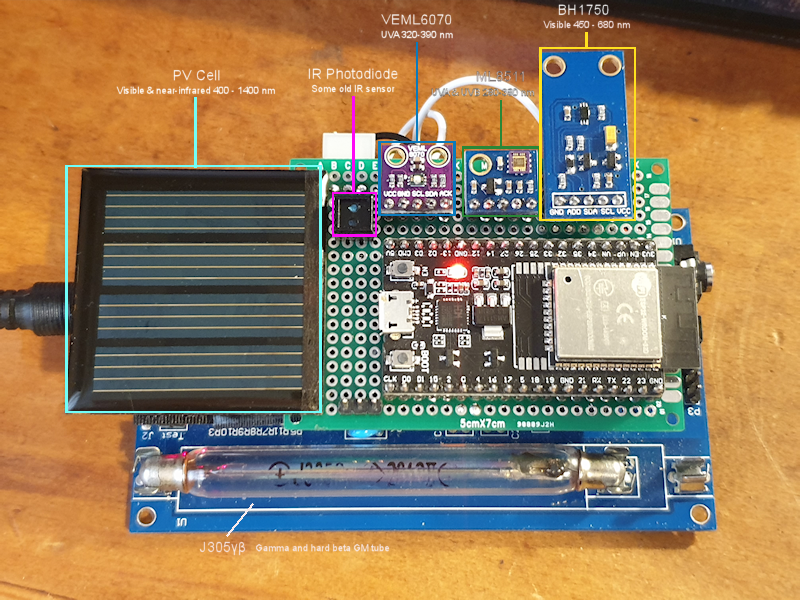
And this image shows the placement of each sensor on the array.
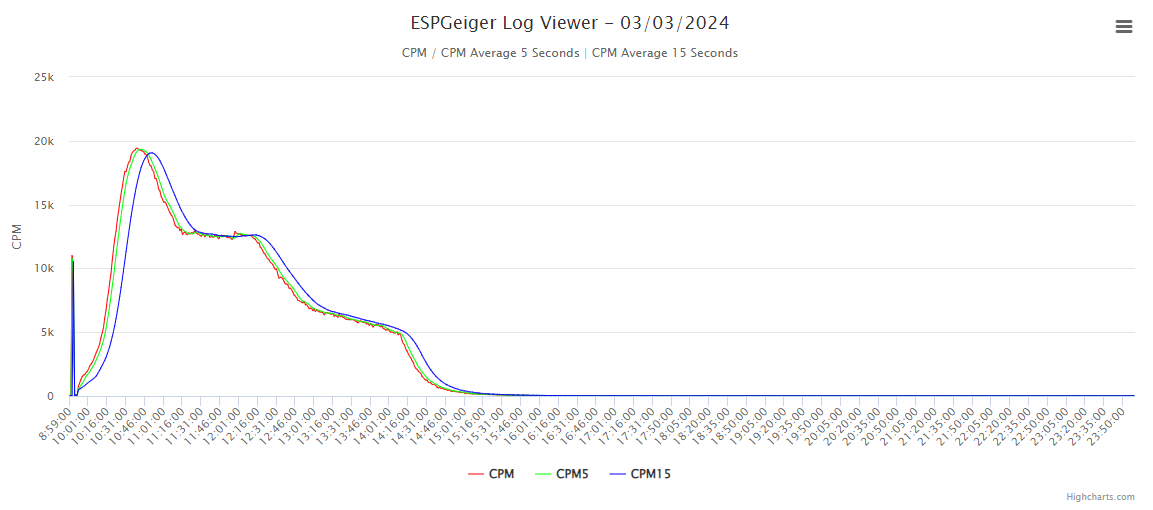
These all together cover quite a large portion of the light spectrum, from 280nm UVB to ~1400nm NIR (near-infrared). My theory was that a certain spectrum of light was affecting the tube, and that spectrum was more prevalent in the mornings. I'm not so sure now and I am starting to wonder if the tube gets less sensitive to daylight the longer it is in daylight. When I first put the J305yb on my window sill for the first time it went crazy. Thousands of counts per minute and kept climbing. I did find this odd that it didn't just peak and then drop off as the day went on, or that for the first day it didn't seem to go up and down with the strength of daylight. It seemed to keep climbing for well over an hour, then started to come down. It's also strange that it has a downward step pattern. This could be the amount of daylight on that day. I don't have any other data from that early on in the experiment. The results of the first day is the graph right below. It's kind of crazy.
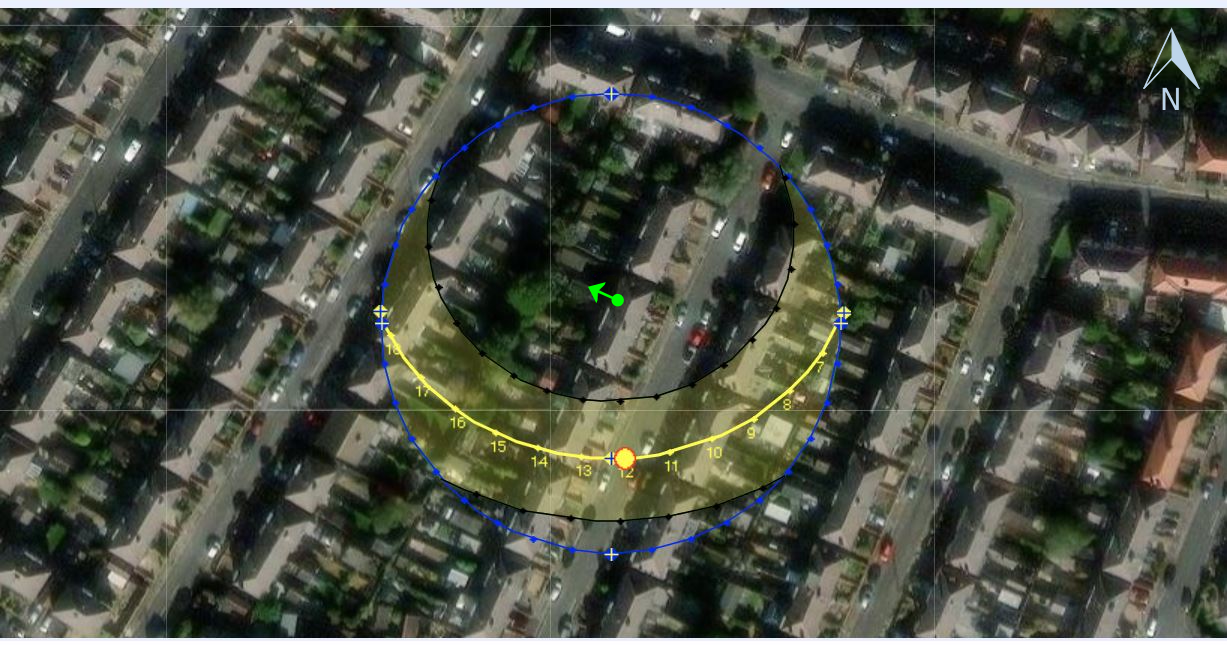
The following image shows the way the array is facing (WNW) and the relation of my house. The sensor array is sat on the 1st floor window sill in my office. It is about 45 degrees vertical and points in the direction shown on the image. I have also plotted the sun's position and you can see that just after 14:00 the sun comes around to the back of the house and only at that point is direct sunlight possible. That image was created a couple of weeks ago so the time has shifted more to 14:30-14:45. So any readings before 14:00 (I'll use this time as the data graphs (attached to the bottom of this post as they are quite lengthy) are in the same time frame) are only reflected light and not direct sunlight, but as you will see in the data graphs the J305yb GM tube is quite different to the light sensors. It should be noted that the array is located inside, behind a double-glazed window.
If you scroll down and examine the data graphs it can clearly be shown the J305yb is certainly not in sync with the strength of the sun. So what is causing the discrepancy? Is it a certain frequency/band of light that affects the GM tube more? Does daylight emit more of a certain spectrum at different times of day? So far all this experiment has done is given me more unanswered questions, which isn't a bad thing if I can answer some of them. Maybe that will come in time. Another thing I have learned so far is that this will probably be a long experiment over many months. I have also learned that I don't have the full picture and that it would be super handy to have the actual light spectrum from a colour spectrometer to compare at different times of day and see if any patterns develop over time. And I do have a colour spectrometer running on Theremino, but there seems to be no way I can automate colour spectrum captures with Theremino, which is a big shame. I could maybe use some software to screen grab a portion of the screen showing the colour spectrum, but in doing so would put my PC mainly out of commission as I use it all the time and having something on the screen being captured 24/7 isn't ideal.
So after some digging I found there was a colour sensing IC (TCS230 or TCS3200) that may do the job, so I bought one. Then I discovered there is a specific IC that will capture 11 bands of light (AS7341), so I bought one of those also. There are 7 or 8 bands in the visible range and also NIR and clear. Clear is all the light, unfiltered.
So what next? I need to get the new sensor (AS7341) added to the array and get that logging the light spectrum every few minutes. I may be able to log it every minute as with the other sensors, although reading the data and comparing with the other sensors will be tricky as you can't show it in a 2-dimensional graph. I could with a 3-dimensional graph, but I have no way of generating one... Yet.... For now though logging the data and I can work out displaying it later. I also need to really do some research into sun light, times of day and a whole load of other stuff. I need to try and calibrate some of the sensors if I can. The old IR sensor will be getting ditched at some point and I want to change it for a better one, preferably one that I can get the data sheet for that will show it's sensing range. I have a couple of old vintage ones somewhere. They look expensive with a nice glass lens on them, if I remember correctly. I think they came from a really old hard drive, either speed sensing or stepper motor end stops. I will dig them out and see if I can get a datasheet for them.
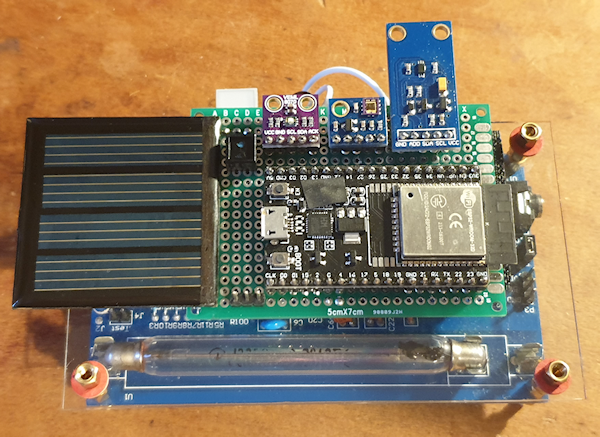
Last night I decided to mount the clear plastic cover to the CAJOE RadiationD-v1.1 and found today that the J305by GM tube had not registered hardly any additional counts except background. That tells me the plastic (acrylic/perspex/whatever it is) is stopping or massively reducing the photon induced counts, so I need to alter that a bit so the light shines right onto the tube. Maybe that is a trait of the light sensitive tubes - that they require light to hit the glass wall of the tube. But I have it behind glass, so why would clear plastic make a difference, but glass windows don't? Again, more questions rather than answers. The image below shows the array mounted to the clear plastic now, and the clear plastic is covering the J305by tube. I think I'll keep it running like this for a couple of days and then cut some of the plastic away to allow the light to hit the tube directly. A couple of issues that have shown up are the BH1705 (visible light sensor) does max out with direct sunlight, the PV cell also did a lot, but I tweaked that last night so will see in time. The old IR sensor seems to suffer with some spikes at random intervals. I'm not sure if this is interference of some kind, or something akin to the ESP32 and firmware and maybe caused by reading the other sensors, or something like that. Again, more questions. But that sensor is going to be swapped out with a different one at some point.
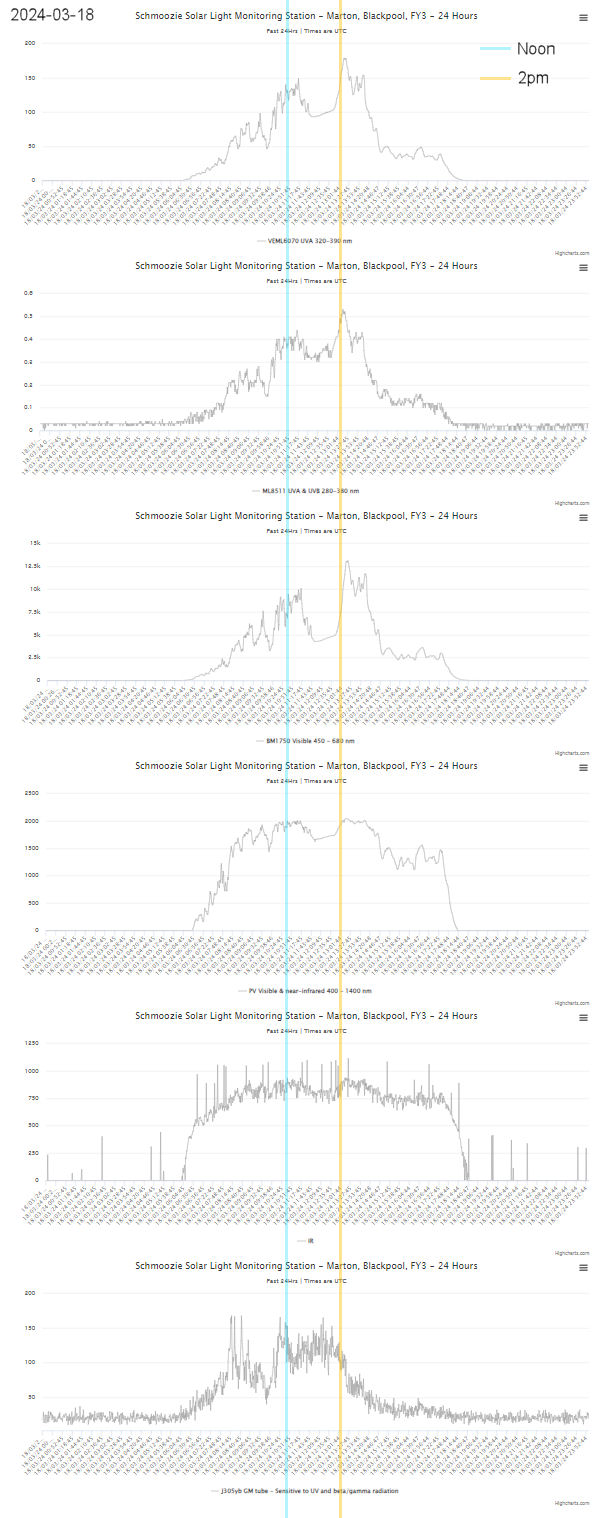
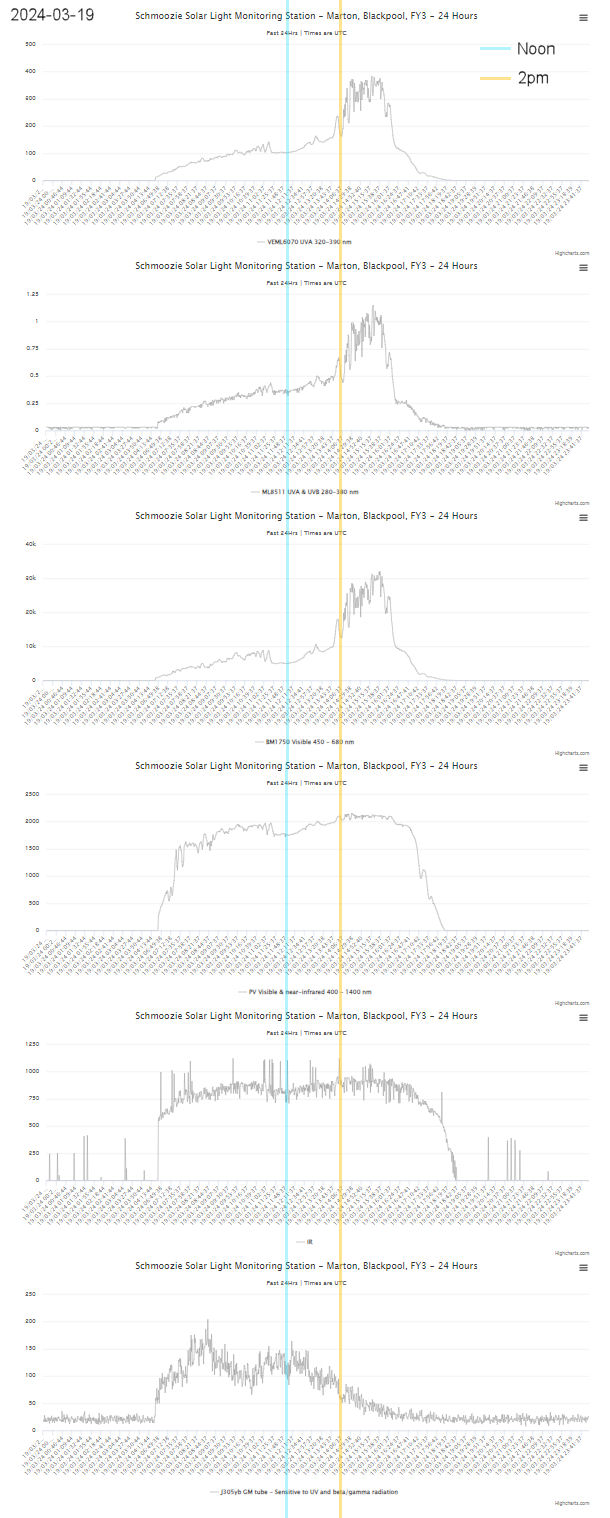
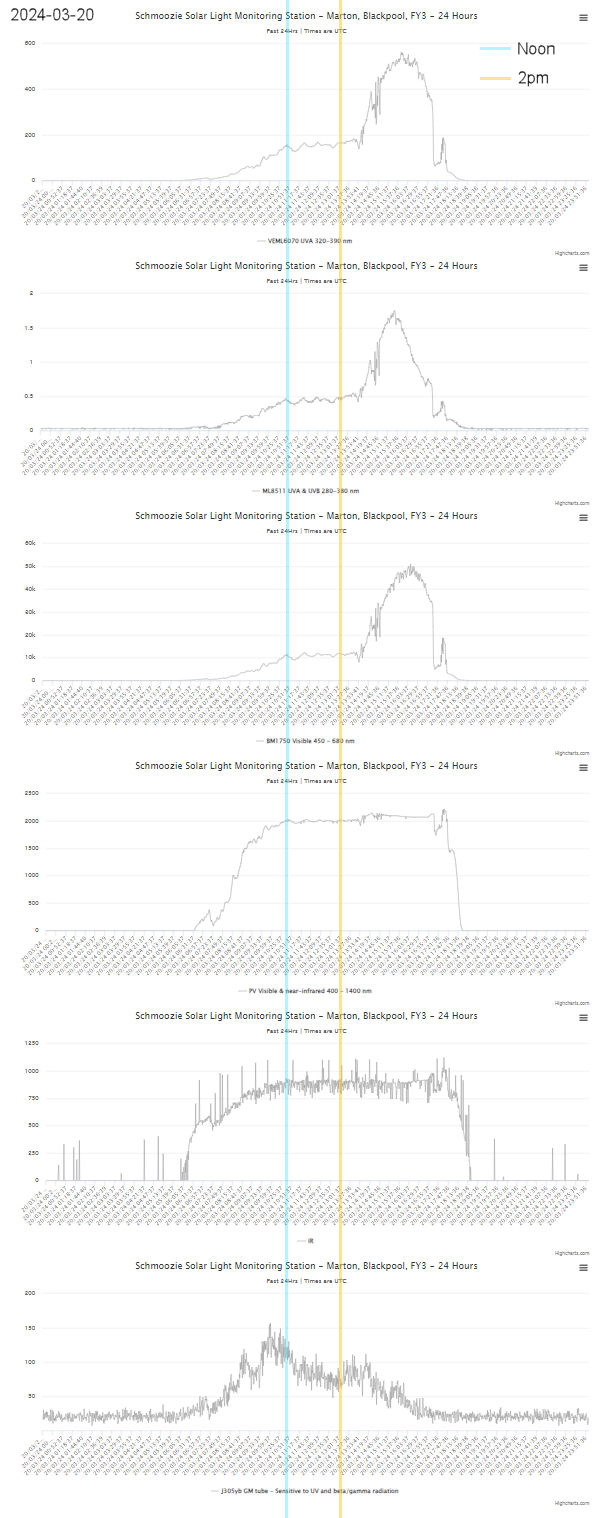
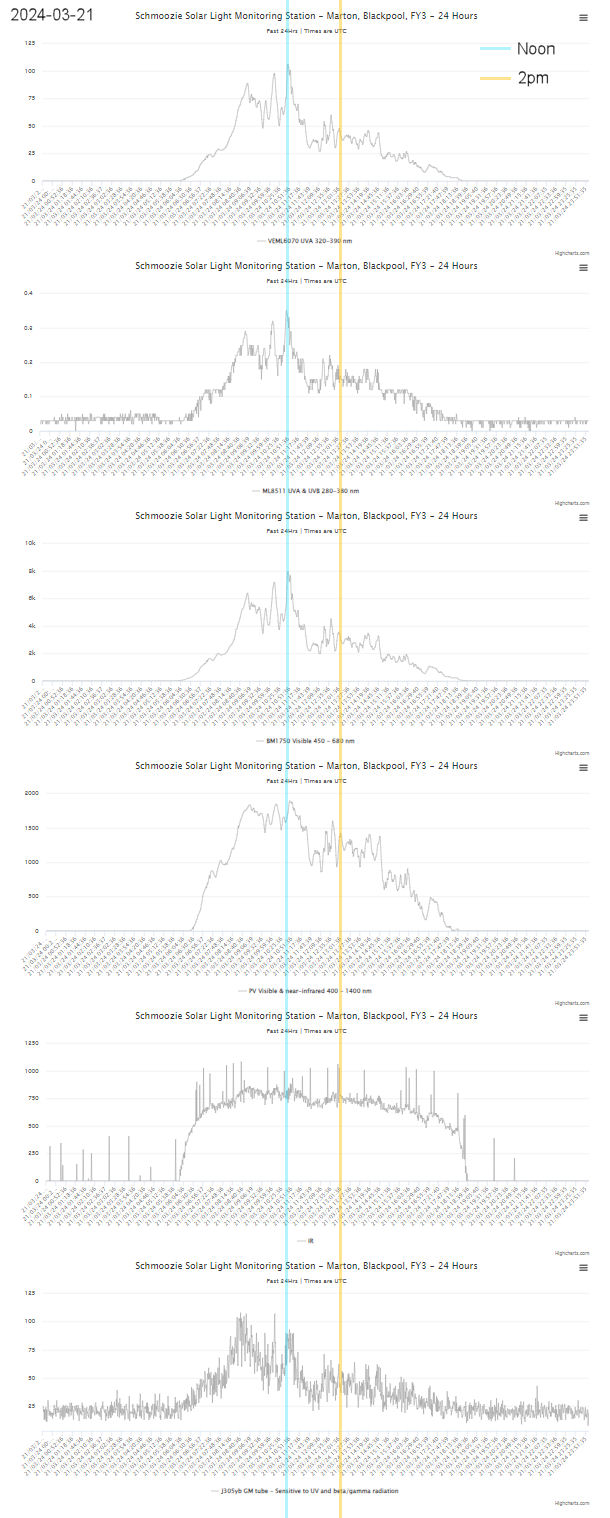
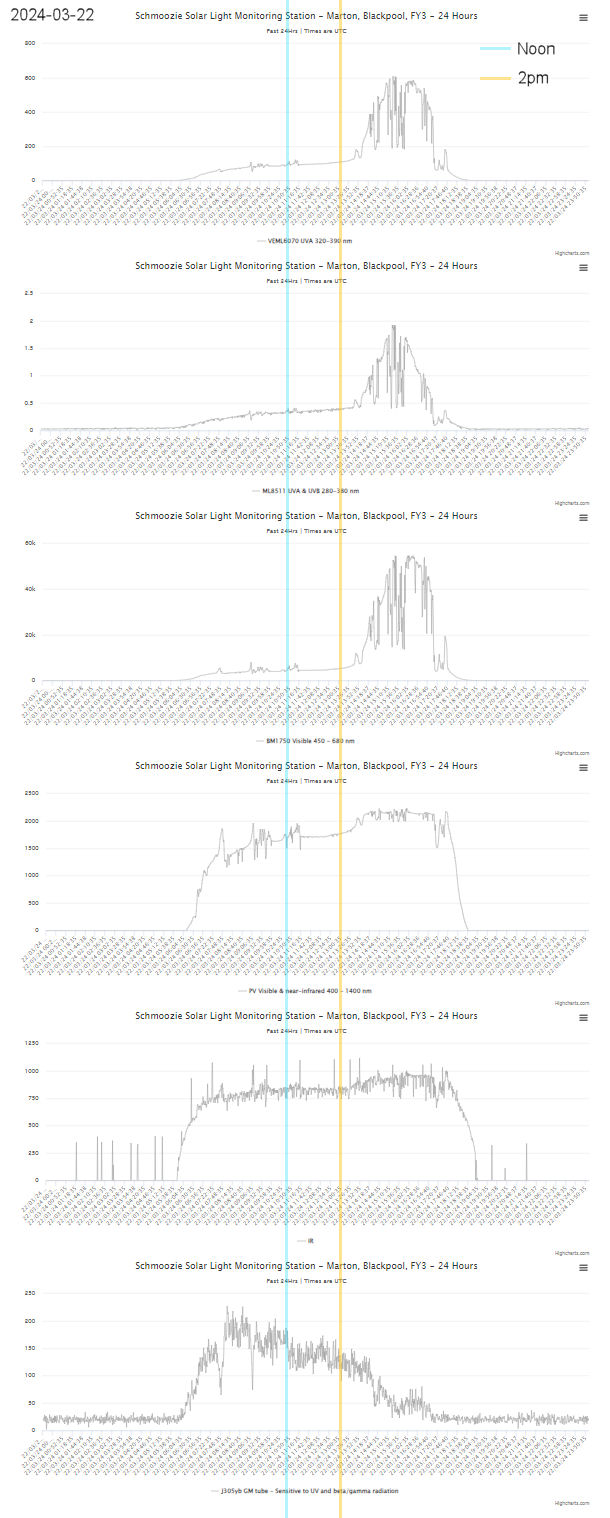
And finally the actual data itself. The graphs are from 5 consecutive days. I have marked lines denoting 12:00 and 14:00. 12:00 is/used to eb generally considered to be the lightest part of the day and 14:00 is when the sun comes around to the rear of the house and then the sensor array gets direct sunlight. Of course this is all dependant on the weather and clouds, and lately it has been pretty miserable weather here. From the data graphs we can clearly see that on the 19th, 20th and 22nd the J530by tube peaked and was dropping as the other light sensors started to pick up. Very, very strange.
My apologies for making this post so long, but I'm struggling to find a better way of showing the data in a more condensed fashion.
2024-03-18
2024-03-19
2024-03-20
2024-03-21
2024-03-22
I have been meaning to write this up for a couple of weeks now, and I finally do it. This is an experiment I am conducting (very loosely at present) that came about from leaving my CAJOE RadiationD-v1.1 with J305by on my window sill for a week and noticed a strange pattern with the 'excess' counts. They were stronger in the morning than in the afternoon, even to the point they were stronger than in direct sunlight. I mentioned this to a couple of members here and we all agree that it is strange, and that we all expected there to be more counts in direct sunlight than in the morning with indirect sunlight. I find this confusing and there has to be a reason, so this experiment is aimed at trying to figure out why. I don't know if it will work or not but I do now have enough data to show that direct sunlight doesn't seem to affect the tube more than indirect, morning sun.
I had some light sensors and bits and bobs, so cobbled them together, hooked up to an ESP32 and started logging the data. And they grew into the 'Solar Monitor 5 Million!'
So, what does it do? It logs CPM from the RadiationD-v1.1 to here (station SimoTester3 ) and then there are 5 other sensors that log to my web server and Blynk. Blynk is so I can view on my phone. The array consists of the following sensors:
- VEML6070 - UVA 320-390 nm
- ML8511 - UVA & UVB 280-380 nm
- BH1750 - Visible 450 - 680 nm
- PV Cell - Visible & near-infrared 400 - 1400 nm
- Some old IR sensor (Photodiode (no idea on spec))
- J305yb GM tube (and counter)
This image shows each sensor's spectrum over the visible light spectrum.
And this image shows the placement of each sensor on the array.
These all together cover quite a large portion of the light spectrum, from 280nm UVB to ~1400nm NIR (near-infrared). My theory was that a certain spectrum of light was affecting the tube, and that spectrum was more prevalent in the mornings. I'm not so sure now and I am starting to wonder if the tube gets less sensitive to daylight the longer it is in daylight. When I first put the J305yb on my window sill for the first time it went crazy. Thousands of counts per minute and kept climbing. I did find this odd that it didn't just peak and then drop off as the day went on, or that for the first day it didn't seem to go up and down with the strength of daylight. It seemed to keep climbing for well over an hour, then started to come down. It's also strange that it has a downward step pattern. This could be the amount of daylight on that day. I don't have any other data from that early on in the experiment. The results of the first day is the graph right below. It's kind of crazy.
The following image shows the way the array is facing (WNW) and the relation of my house. The sensor array is sat on the 1st floor window sill in my office. It is about 45 degrees vertical and points in the direction shown on the image. I have also plotted the sun's position and you can see that just after 14:00 the sun comes around to the back of the house and only at that point is direct sunlight possible. That image was created a couple of weeks ago so the time has shifted more to 14:30-14:45. So any readings before 14:00 (I'll use this time as the data graphs (attached to the bottom of this post as they are quite lengthy) are in the same time frame) are only reflected light and not direct sunlight, but as you will see in the data graphs the J305yb GM tube is quite different to the light sensors. It should be noted that the array is located inside, behind a double-glazed window.
If you scroll down and examine the data graphs it can clearly be shown the J305yb is certainly not in sync with the strength of the sun. So what is causing the discrepancy? Is it a certain frequency/band of light that affects the GM tube more? Does daylight emit more of a certain spectrum at different times of day? So far all this experiment has done is given me more unanswered questions, which isn't a bad thing if I can answer some of them. Maybe that will come in time. Another thing I have learned so far is that this will probably be a long experiment over many months. I have also learned that I don't have the full picture and that it would be super handy to have the actual light spectrum from a colour spectrometer to compare at different times of day and see if any patterns develop over time. And I do have a colour spectrometer running on Theremino, but there seems to be no way I can automate colour spectrum captures with Theremino, which is a big shame. I could maybe use some software to screen grab a portion of the screen showing the colour spectrum, but in doing so would put my PC mainly out of commission as I use it all the time and having something on the screen being captured 24/7 isn't ideal.
So after some digging I found there was a colour sensing IC (TCS230 or TCS3200) that may do the job, so I bought one. Then I discovered there is a specific IC that will capture 11 bands of light (AS7341), so I bought one of those also. There are 7 or 8 bands in the visible range and also NIR and clear. Clear is all the light, unfiltered.
So what next? I need to get the new sensor (AS7341) added to the array and get that logging the light spectrum every few minutes. I may be able to log it every minute as with the other sensors, although reading the data and comparing with the other sensors will be tricky as you can't show it in a 2-dimensional graph. I could with a 3-dimensional graph, but I have no way of generating one... Yet.... For now though logging the data and I can work out displaying it later. I also need to really do some research into sun light, times of day and a whole load of other stuff. I need to try and calibrate some of the sensors if I can. The old IR sensor will be getting ditched at some point and I want to change it for a better one, preferably one that I can get the data sheet for that will show it's sensing range. I have a couple of old vintage ones somewhere. They look expensive with a nice glass lens on them, if I remember correctly. I think they came from a really old hard drive, either speed sensing or stepper motor end stops. I will dig them out and see if I can get a datasheet for them.
Last night I decided to mount the clear plastic cover to the CAJOE RadiationD-v1.1 and found today that the J305by GM tube had not registered hardly any additional counts except background. That tells me the plastic (acrylic/perspex/whatever it is) is stopping or massively reducing the photon induced counts, so I need to alter that a bit so the light shines right onto the tube. Maybe that is a trait of the light sensitive tubes - that they require light to hit the glass wall of the tube. But I have it behind glass, so why would clear plastic make a difference, but glass windows don't? Again, more questions rather than answers. The image below shows the array mounted to the clear plastic now, and the clear plastic is covering the J305by tube. I think I'll keep it running like this for a couple of days and then cut some of the plastic away to allow the light to hit the tube directly. A couple of issues that have shown up are the BH1705 (visible light sensor) does max out with direct sunlight, the PV cell also did a lot, but I tweaked that last night so will see in time. The old IR sensor seems to suffer with some spikes at random intervals. I'm not sure if this is interference of some kind, or something akin to the ESP32 and firmware and maybe caused by reading the other sensors, or something like that. Again, more questions. But that sensor is going to be swapped out with a different one at some point.
And finally the actual data itself. The graphs are from 5 consecutive days. I have marked lines denoting 12:00 and 14:00. 12:00 is/used to eb generally considered to be the lightest part of the day and 14:00 is when the sun comes around to the rear of the house and then the sensor array gets direct sunlight. Of course this is all dependant on the weather and clouds, and lately it has been pretty miserable weather here. From the data graphs we can clearly see that on the 19th, 20th and 22nd the J530by tube peaked and was dropping as the other light sensors started to pick up. Very, very strange.
My apologies for making this post so long, but I'm struggling to find a better way of showing the data in a more condensed fashion.
2024-03-18
2024-03-19
2024-03-20
2024-03-21
2024-03-22
Attachments:
Last edit: 2 weeks 5 days ago by Simomax.
Please Log in or Create an account to join the conversation.
6 days 10 hours ago #6937
by mw0uzo
Replied by mw0uzo on topic Fun with the sun - The Solar Monitor 5 Million! (Experiment)
What a post! Brilliant!!
Please Log in or Create an account to join the conversation.
5 days 13 hours ago - 5 days 13 hours ago #6938
by Simomax
Thanks Dan.
I have been meaning to write an update as I have added a couple of new sensors. One of which is my very own invention - straight from the old grey matter. I have also made some improvements and things seem pretty stable. I have improved the web pages for displaying the data and is now easy to go back and forwards day by day to view the data.
For some reason the ESP32 started counting something like 10x the actual counts from the counter. I think this happened after I added an AS7341 sensor, or something. I have had other issues with the ESP32 slowing to a crawl. I guess this is what happens when you cram a boat load of sensors on one small MCU. Or, my less than optimal programming skills. Or maybe a bit of both. Anyway, I added an Arduino Pro Mini to offload some CPU cycles (I think more like timing locks or something from the sensor libraries) and run the AS7341 and the Geiger counter on the pro mini, and that sends the data to the ESP32. It all works very nicely now. The little spikes that were showing on the old IR sensor have gone away. I don't know how. I didn't do anything. I must have done something, but I don't know. I also cut away at the plastic cover on the RadiationD-v1.1 and moved the sensor board back so the GM tube gets more light now and isn't affected by the plastic/acrylic/perspex/Chinesium see-through stuff, whatever it is.
This is what the array looks like now. not much different, but better placement allowing the GM tube more direct sun light. The new AS7341 sensor is mounted at the top right.
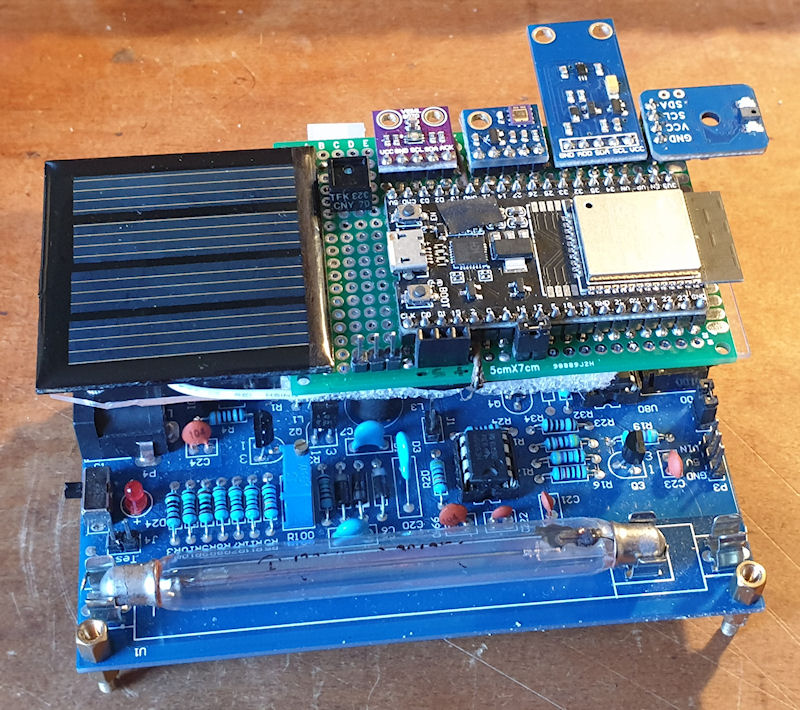
The AS7341 sensor is like an 8-band colour spectrometer. It picks up 8 individual specific colour frequencies across the visible band. It also has a 'clear' sensor and a near-infrared sensor, making up the 10 bands. The 'clear' sensor is one that receives all the light spectrum and isn't filtered. The 8 colour bands are the same sensor but with a colour filter for a specific colour frequency. And NIR is just that. Capturing the data from this sensor is easy, but displaying it is not. I think I need to create some kind of 3 dimensional graph, so that will come later. For now though you can see an example of the data on a 2D graph. It is interesting to see the different light levels of the different colours/frequencies. These graphs are fairly parallel but some days haven't been quite so. The link for the data/graphs etc is at the bottom of this post if you want to have a look.
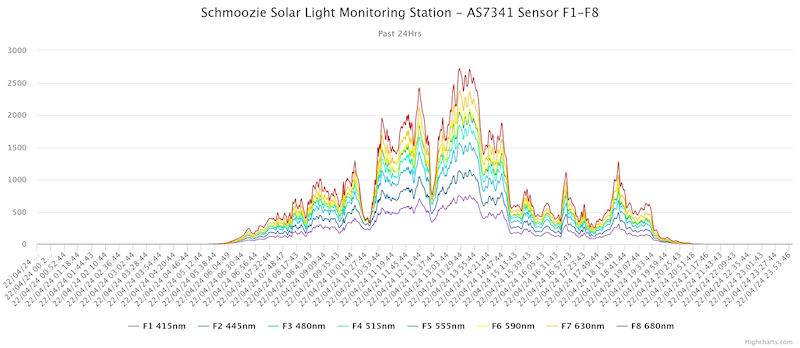
This is the 8 bands of visible light from the AS7341.
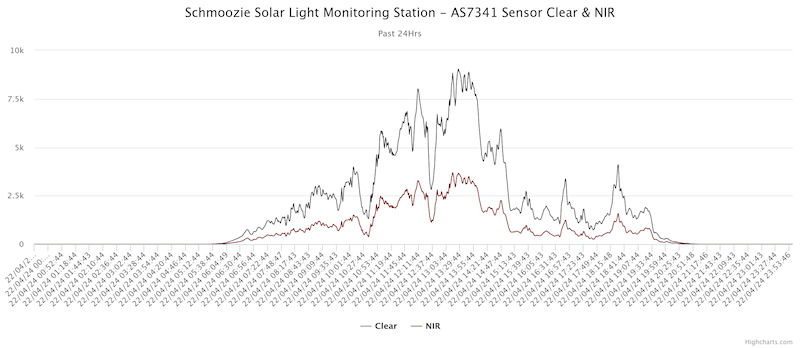
And the 'clear' and NIR from the AS7341
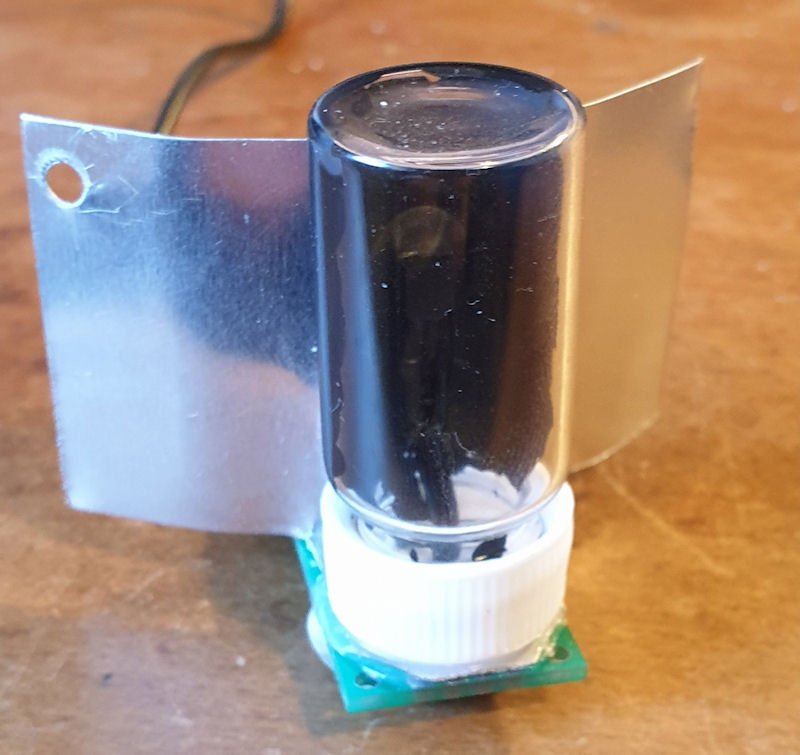
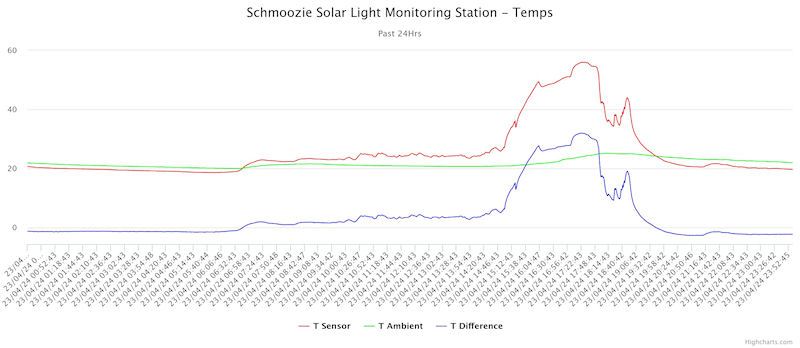
The second sensor is for temperature. I thought it would be nice to be able to actually put an indication to how hot the sun light is. I figured I would need to build some kind of solar heat collector. I went for a small glass sample bottle with a Dallas 18B20 temperature sensor glued to the inside and then the rear inside half of the bottle painted black with matt black paint. It works very well so far although I have had to make some changes. There is 2nd Dallas 18B20 temp sensor that I mounted behind the main sensor and tried to shield the sun from that, but it didn't work very well and was getting too hot too fast. I removed the 2nd sensor from behind the first one and it is now stuck to the wall in my office. The temp from that is much more stable now although does rise a little during the day and also when the heating is on. With the two temperature sensors I can take one from the other to give a temperature reading that would be ## degrees above ambient. You can see in the graph below. It does need improvements as I think some of the heat collected is radiating out so my plan is to insulate it. The Dallas 18B20 ranges from about -125 to +125 degrees Celsius with +-0.5 degrees accuracy. It is factory calibrated and simply gives the reading so is very easy to integrate. It uses just one wire and they can be paralleled up on the same wire, so very easy to use.
This is the first iteration of the sensor and you can see the 2nd Dallas sensor at the rear. Now it is just the bottle I plan to make a box, insulate it a lot and stick the bottle sensor in the middle of all the insulation so should stop some heat radiating away.
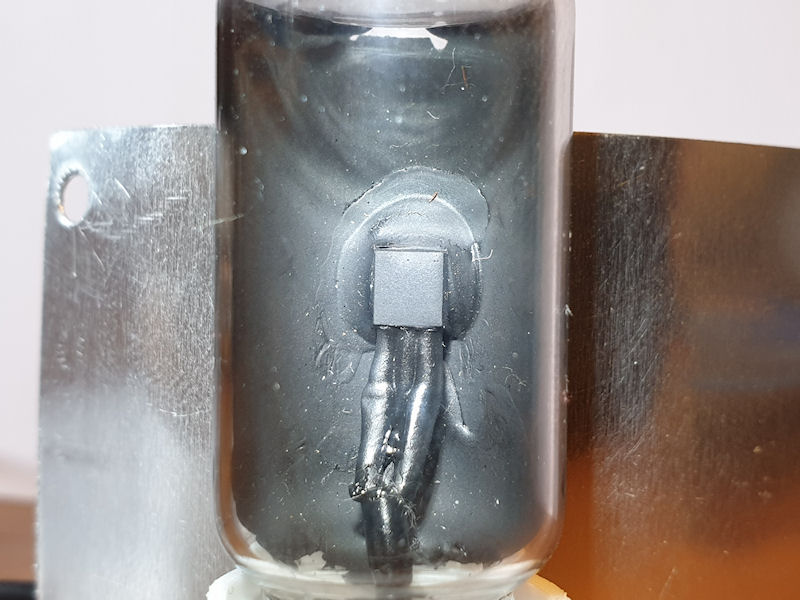
The Dallas 18B20 is glued to the inside of the bottle with epoxy and then painted with matt black to try and absorb as much heat as possible.
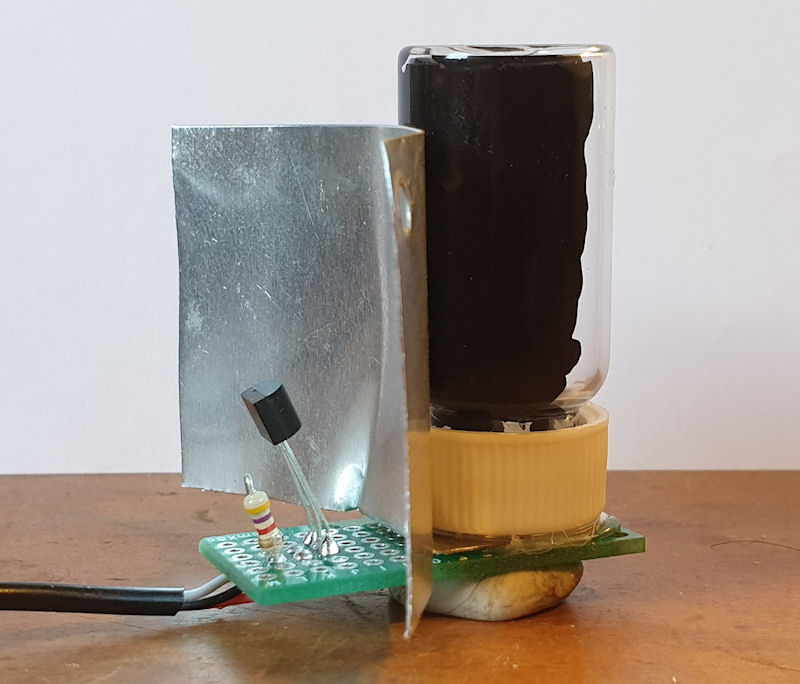
You can see the 2nd Dallas 18B20 mounted behind the bottle sensor. This has now been changed and the 2nd sensor is stuck to my office wall where it gets a much more stable temperature reading.
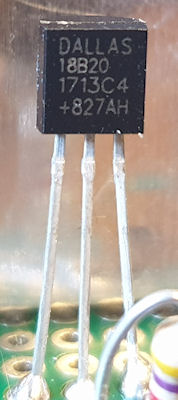
This is the Dallas 18B20 temperature sensor.
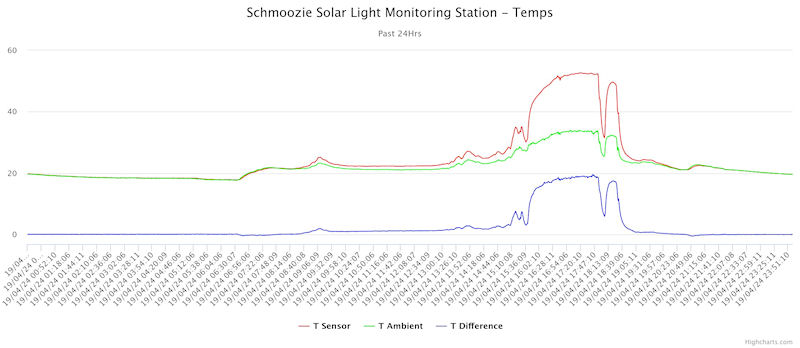
This is the kind of data I am getting from the temp sensors. It clearly shows a massive difference between ambient (in the shade) and direct sun light. This graph is from before I moved the 2nd sensor on to my wall and you can see it is affected by the sun light. The later graphs (on the web page - link below) show it a lot more stable, but does give a little deviance from the bottle sensor. I'm not too bothered about a +- 2 degree deviance as when the sun hits the bottle sensor it shows a large difference.
This is after moving the 2nd temp sensor. The ambient temperature is much more stable now but does give some deviance. Getting a decent solid ambient temp reading is very hard as the sun heats up my house, and so does the heating, making the ambient change a bit. As the (bottle) sensor is in my window, opening my windows causes the temperature of that sensor to drop. Mega insulating the bottle sensor should alleviate some of this.
The old IR sensor stopped showing the little spikes for a reason I do not know, but I don't mind the results. I have actually started to appreciate the data that little sensor gives as it ramps up quickly as the sun comes up and ramps down quickly also, as the sun goes down. Comparing the data from that IR sensor to the sunrise/sunset times it appears as though the IR sensor is picking up daylight a few minutes before the actual sunrise time and then falls to 0 a few minutes after sunset. It is basically an indicator for any light and no light. I did think about swapping it for a different one, but I think I will keep this for now.
What next? For now keep gathering data, making tweaks and changes to give the readings better validity. It would be nice to get hold of a calibrated UVA/UVB meter so I can calibrate my own sensors against that. Good UVA/UVB meters aren't cheap to buy, but I may be able to hire one for a week. It's a thought. I have ordered some more sensors to have a look at. These are:
TEMT6000 - Described as an ambient light sensor. Not sure what this will do/be like. I suspect something similar to the old IR sensor, but more in the visible range.
TCS3472 - An RGB Colour Sensor. From the datasheet: The TCS3472 device provides a digital return of red, green, blue (RGB), and clear light sensing values. An IR
blocking filter, integrated on-chip and localized to the colour sensing photodiodes, minimizes the IR spectral
component of the incoming light and allows colour measurements to be made accurately.
GUVA-S12SD - Analog UV sensor module. It uses a UV photodiode, which can detect the 240-370nm range of light (which covers UVB and most of UVA spectrum).
VEML7700 - I think this is similar to the VEML6070 (UVA) but gives the actual lux value.
Once I receive the new sensors I will get them up and running on another ESP or something before integrating them into the array. That is if I plan to use any after testing them. I am also still looking at ways I can use my colour spectrometer and capture the spectrum of daylight at 5/10 minute intervals. I could just throw up another PC to run it and use some image grabbing software to capture just part of the screen. That said, I am conscious of electricity consumption these days, so burning 100 watts of electricity just for that is not really justifiable. I wouldn't mind so much at about 15-20 watts, if there is a PC out there that will run at that? Raspberry Pi is also an option, but not sure if I could get my USB spectrometer working with that. I still need to look at the TCS230/TCS3200 RGB sensor as I think I may be able to use that to capture the colour of the sky. Another thing I am looking at is running an IR camera module on a Pi 3 to capture time lapse images of the actual sky itself. In capturing images of the sky, it would be easy to compare the sensor readings to how the sky way at a particular time. (It may also be used to see how much stratospheric aerosol geoengineering is actually going on around me, but that is a conversation for another day!)
And that is about it for this update. I will post more as and when.
Oh, I ordered a new CAJOE RadiationD-v1.1 with J305by tube so I could do some testing alongside of the main array. I received it, put in the new tube, shone a UV torch at it.... And nothing. The new J305by I received is not light sensitive! I was surprised. Maybe it is only the older tubes that react to light. I do need to check the HV voltage on the new RadiationD-v1.1 but does work fine for radioactive sources, so I can only assume this new tube is not sensitive to light. If there is anyone that does have a J305 that is sensitive to light and would like to swap for a brand new one one that isn't light sensitive, please let me know. Obviously dependant on postage costs etc.
You can see the live/recorded data here: http://www.schmoozie.co.uk/solarmonitor/
Replied by Simomax on topic Fun with the sun - The Solar Monitor 5 Million! (Experiment)
I have been meaning to write an update as I have added a couple of new sensors. One of which is my very own invention - straight from the old grey matter. I have also made some improvements and things seem pretty stable. I have improved the web pages for displaying the data and is now easy to go back and forwards day by day to view the data.
For some reason the ESP32 started counting something like 10x the actual counts from the counter. I think this happened after I added an AS7341 sensor, or something. I have had other issues with the ESP32 slowing to a crawl. I guess this is what happens when you cram a boat load of sensors on one small MCU. Or, my less than optimal programming skills. Or maybe a bit of both. Anyway, I added an Arduino Pro Mini to offload some CPU cycles (I think more like timing locks or something from the sensor libraries) and run the AS7341 and the Geiger counter on the pro mini, and that sends the data to the ESP32. It all works very nicely now. The little spikes that were showing on the old IR sensor have gone away. I don't know how. I didn't do anything. I must have done something, but I don't know. I also cut away at the plastic cover on the RadiationD-v1.1 and moved the sensor board back so the GM tube gets more light now and isn't affected by the plastic/acrylic/perspex/Chinesium see-through stuff, whatever it is.
This is what the array looks like now. not much different, but better placement allowing the GM tube more direct sun light. The new AS7341 sensor is mounted at the top right.
The AS7341 sensor is like an 8-band colour spectrometer. It picks up 8 individual specific colour frequencies across the visible band. It also has a 'clear' sensor and a near-infrared sensor, making up the 10 bands. The 'clear' sensor is one that receives all the light spectrum and isn't filtered. The 8 colour bands are the same sensor but with a colour filter for a specific colour frequency. And NIR is just that. Capturing the data from this sensor is easy, but displaying it is not. I think I need to create some kind of 3 dimensional graph, so that will come later. For now though you can see an example of the data on a 2D graph. It is interesting to see the different light levels of the different colours/frequencies. These graphs are fairly parallel but some days haven't been quite so. The link for the data/graphs etc is at the bottom of this post if you want to have a look.
This is the 8 bands of visible light from the AS7341.
And the 'clear' and NIR from the AS7341
The second sensor is for temperature. I thought it would be nice to be able to actually put an indication to how hot the sun light is. I figured I would need to build some kind of solar heat collector. I went for a small glass sample bottle with a Dallas 18B20 temperature sensor glued to the inside and then the rear inside half of the bottle painted black with matt black paint. It works very well so far although I have had to make some changes. There is 2nd Dallas 18B20 temp sensor that I mounted behind the main sensor and tried to shield the sun from that, but it didn't work very well and was getting too hot too fast. I removed the 2nd sensor from behind the first one and it is now stuck to the wall in my office. The temp from that is much more stable now although does rise a little during the day and also when the heating is on. With the two temperature sensors I can take one from the other to give a temperature reading that would be ## degrees above ambient. You can see in the graph below. It does need improvements as I think some of the heat collected is radiating out so my plan is to insulate it. The Dallas 18B20 ranges from about -125 to +125 degrees Celsius with +-0.5 degrees accuracy. It is factory calibrated and simply gives the reading so is very easy to integrate. It uses just one wire and they can be paralleled up on the same wire, so very easy to use.
This is the first iteration of the sensor and you can see the 2nd Dallas sensor at the rear. Now it is just the bottle I plan to make a box, insulate it a lot and stick the bottle sensor in the middle of all the insulation so should stop some heat radiating away.
The Dallas 18B20 is glued to the inside of the bottle with epoxy and then painted with matt black to try and absorb as much heat as possible.
You can see the 2nd Dallas 18B20 mounted behind the bottle sensor. This has now been changed and the 2nd sensor is stuck to my office wall where it gets a much more stable temperature reading.
This is the Dallas 18B20 temperature sensor.
This is the kind of data I am getting from the temp sensors. It clearly shows a massive difference between ambient (in the shade) and direct sun light. This graph is from before I moved the 2nd sensor on to my wall and you can see it is affected by the sun light. The later graphs (on the web page - link below) show it a lot more stable, but does give a little deviance from the bottle sensor. I'm not too bothered about a +- 2 degree deviance as when the sun hits the bottle sensor it shows a large difference.
This is after moving the 2nd temp sensor. The ambient temperature is much more stable now but does give some deviance. Getting a decent solid ambient temp reading is very hard as the sun heats up my house, and so does the heating, making the ambient change a bit. As the (bottle) sensor is in my window, opening my windows causes the temperature of that sensor to drop. Mega insulating the bottle sensor should alleviate some of this.
The old IR sensor stopped showing the little spikes for a reason I do not know, but I don't mind the results. I have actually started to appreciate the data that little sensor gives as it ramps up quickly as the sun comes up and ramps down quickly also, as the sun goes down. Comparing the data from that IR sensor to the sunrise/sunset times it appears as though the IR sensor is picking up daylight a few minutes before the actual sunrise time and then falls to 0 a few minutes after sunset. It is basically an indicator for any light and no light. I did think about swapping it for a different one, but I think I will keep this for now.
What next? For now keep gathering data, making tweaks and changes to give the readings better validity. It would be nice to get hold of a calibrated UVA/UVB meter so I can calibrate my own sensors against that. Good UVA/UVB meters aren't cheap to buy, but I may be able to hire one for a week. It's a thought. I have ordered some more sensors to have a look at. These are:
TEMT6000 - Described as an ambient light sensor. Not sure what this will do/be like. I suspect something similar to the old IR sensor, but more in the visible range.
TCS3472 - An RGB Colour Sensor. From the datasheet: The TCS3472 device provides a digital return of red, green, blue (RGB), and clear light sensing values. An IR
blocking filter, integrated on-chip and localized to the colour sensing photodiodes, minimizes the IR spectral
component of the incoming light and allows colour measurements to be made accurately.
GUVA-S12SD - Analog UV sensor module. It uses a UV photodiode, which can detect the 240-370nm range of light (which covers UVB and most of UVA spectrum).
VEML7700 - I think this is similar to the VEML6070 (UVA) but gives the actual lux value.
Once I receive the new sensors I will get them up and running on another ESP or something before integrating them into the array. That is if I plan to use any after testing them. I am also still looking at ways I can use my colour spectrometer and capture the spectrum of daylight at 5/10 minute intervals. I could just throw up another PC to run it and use some image grabbing software to capture just part of the screen. That said, I am conscious of electricity consumption these days, so burning 100 watts of electricity just for that is not really justifiable. I wouldn't mind so much at about 15-20 watts, if there is a PC out there that will run at that? Raspberry Pi is also an option, but not sure if I could get my USB spectrometer working with that. I still need to look at the TCS230/TCS3200 RGB sensor as I think I may be able to use that to capture the colour of the sky. Another thing I am looking at is running an IR camera module on a Pi 3 to capture time lapse images of the actual sky itself. In capturing images of the sky, it would be easy to compare the sensor readings to how the sky way at a particular time. (It may also be used to see how much stratospheric aerosol geoengineering is actually going on around me, but that is a conversation for another day!)
And that is about it for this update. I will post more as and when.
Oh, I ordered a new CAJOE RadiationD-v1.1 with J305by tube so I could do some testing alongside of the main array. I received it, put in the new tube, shone a UV torch at it.... And nothing. The new J305by I received is not light sensitive! I was surprised. Maybe it is only the older tubes that react to light. I do need to check the HV voltage on the new RadiationD-v1.1 but does work fine for radioactive sources, so I can only assume this new tube is not sensitive to light. If there is anyone that does have a J305 that is sensitive to light and would like to swap for a brand new one one that isn't light sensitive, please let me know. Obviously dependant on postage costs etc.
You can see the live/recorded data here: http://www.schmoozie.co.uk/solarmonitor/
Attachments:
Last edit: 5 days 13 hours ago by Simomax.
Please Log in or Create an account to join the conversation.
Moderators: Gamma-Man
- Forum
- Experiments and Projects
- Experiments
- Fun with the sun - The Solar Monitor 5 Million! (Experiment)
Time to create page: 0.242 seconds